Aleut vs White/Caucasian Child Poverty Under the Age of 16

COMPARE

Aleut
Race
Ancestry
AfghanAfricanAlaska NativeAlaskan AthabascanAlbanianAleutAlsatianAmericanApacheArabArapahoArgentineanArmenianAssyrian/Chaldean/SyriacAustralianAustrianBahamianBangladeshiBarbadianBasqueBelgianBelizeanBermudanBhutaneseBlackfeetBolivianBrazilianBritishBritish West IndianBulgarianBurmeseCajunCambodianCanadianCape VerdeanCarpatho RusynCelticCentral AmericanCentral American IndianCherokeeCheyenneChickasawChileanChineseChippewaChoctawColombianColvilleComancheCosta RicanCreeCreekCroatianCrowCubanCypriotCzechCzechoslovakianDanishDelawareDominicanDutchDutch West IndianEastern EuropeanEcuadorianEgyptianEnglishEstonianEthiopianEuropeanFijianFilipinoFinnishFrenchFrench American IndianFrench CanadianGermanGerman RussianGhanaianGreekGuamanian/ChamorroGuatemalanGuyaneseHaitianHmongHonduranHopiHoumaHungarianIcelanderIndian (Asian)IndonesianInupiatIranianIraqiIrishIroquoisIsraeliItalianJamaicanJapaneseJordanianKenyanKiowaKoreanLaotianLatvianLebaneseLiberianLithuanianLumbeeLuxembourgerMacedonianMalaysianMalteseMarshalleseMenomineeMexicanMexican American IndianMongolianMoroccanNative HawaiianNavajoNepaleseNew ZealanderNicaraguanNigerianNorthern EuropeanNorwegianOkinawanOsageOttawaPaiutePakistaniPalestinianPanamanianParaguayanPennsylvania GermanPeruvianPimaPolishPortuguesePotawatomiPuebloPuerto RicanPuget Sound SalishRomanianRussianSalvadoranSamoanScandinavianScotch-IrishScottishSeminoleSenegaleseSerbianShoshoneSierra LeoneanSiouxSlavicSlovakSloveneSomaliSouth AfricanSouth AmericanSouth American IndianSoviet UnionSpaniardSpanishSpanish AmericanSpanish American IndianSri LankanSubsaharan AfricanSudaneseSwedishSwissSyrianTaiwaneseThaiTlingit-HaidaTohono O'OdhamTonganTrinidadian and TobagonianTsimshianTurkishU.S. Virgin IslanderUgandanUkrainianUruguayanUteVenezuelanVietnameseWelshWest IndianYakamaYaquiYugoslavianYumanYup'ikZimbabwean
Immigration
NonimmigrantsImmigrantsAfghanistanAfricaAlbaniaArgentinaArmeniaAsiaAustraliaAustriaBahamasBangladeshBarbadosBelarusBelgiumBelizeBoliviaBosnia and HerzegovinaBrazilBulgariaBurma/MyanmarCabo VerdeCambodiaCameroonCanadaCaribbeanCentral AmericaChileChinaColombiaCongoCosta RicaCroatiaCubaCzechoslovakiaDenmarkDominicaDominican RepublicEastern AfricaEastern AsiaEastern EuropeEcuadorEgyptEl SalvadorEnglandEritreaEthiopiaEuropeFijiFranceGermanyGhanaGreeceGrenadaGuatemalaGuyanaHaitiHondurasHong KongHungaryIndiaIndonesiaIranIraqIrelandIsraelItalyJamaicaJapanJordanKazakhstanKenyaKoreaKuwaitLaosLatin AmericaLatviaLebanonLiberiaLithuaniaMalaysiaMexicoMicronesiaMiddle AfricaMoldovaMoroccoNepalNetherlandsNicaraguaNigeriaNorth AmericaNorth MacedoniaNorthern AfricaNorthern EuropeNorwayOceaniaPakistanPanamaPeruPhilippinesPolandPortugalRomaniaRussiaSaudi ArabiaScotlandSenegalSerbiaSierra LeoneSingaporeSomaliaSouth AfricaSouth AmericaSouth Central AsiaSouth Eastern AsiaSouthern EuropeSpainSri LankaSt. Vincent and the GrenadinesSudanSwedenSwitzerlandSyriaTaiwanThailandTrinidad and TobagoTurkeyUgandaUkraineUruguayUzbekistanVenezuelaVietnamWest IndiesWestern AfricaWestern AsiaWestern EuropeYemenZaireZimbabweAzores
White/Caucasian
Race
Ancestry
AfghanAfricanAlaska NativeAlaskan AthabascanAlbanianAlsatianAmericanApacheArabArapahoArgentineanArmenianAssyrian/Chaldean/SyriacAustralianAustrianBahamianBangladeshiBarbadianBasqueBelgianBelizeanBermudanBhutaneseBlackfeetBolivianBrazilianBritishBritish West IndianBulgarianBurmeseCajunCambodianCanadianCape VerdeanCarpatho RusynCelticCentral AmericanCentral American IndianCherokeeCheyenneChickasawChileanChineseChippewaChoctawColombianColvilleComancheCosta RicanCreeCreekCroatianCrowCubanCypriotCzechCzechoslovakianDanishDelawareDominicanDutchDutch West IndianEastern EuropeanEcuadorianEgyptianEnglishEstonianEthiopianEuropeanFijianFilipinoFinnishFrenchFrench American IndianFrench CanadianGermanGerman RussianGhanaianGreekGuamanian/ChamorroGuatemalanGuyaneseHaitianHmongHonduranHopiHoumaHungarianIcelanderIndian (Asian)IndonesianInupiatIranianIraqiIrishIroquoisIsraeliItalianJamaicanJapaneseJordanianKenyanKiowaKoreanLaotianLatvianLebaneseLiberianLithuanianLumbeeLuxembourgerMacedonianMalaysianMalteseMarshalleseMenomineeMexicanMexican American IndianMongolianMoroccanNative HawaiianNavajoNepaleseNew ZealanderNicaraguanNigerianNorthern EuropeanNorwegianOkinawanOsageOttawaPaiutePakistaniPalestinianPanamanianParaguayanPennsylvania GermanPeruvianPimaPolishPortuguesePotawatomiPuebloPuerto RicanPuget Sound SalishRomanianRussianSalvadoranSamoanScandinavianScotch-IrishScottishSeminoleSenegaleseSerbianShoshoneSierra LeoneanSiouxSlavicSlovakSloveneSomaliSouth AfricanSouth AmericanSouth American IndianSoviet UnionSpaniardSpanishSpanish AmericanSpanish American IndianSri LankanSubsaharan AfricanSudaneseSwedishSwissSyrianTaiwaneseThaiTlingit-HaidaTohono O'OdhamTonganTrinidadian and TobagonianTsimshianTurkishU.S. Virgin IslanderUgandanUkrainianUruguayanUteVenezuelanVietnameseWelshWest IndianYakamaYaquiYugoslavianYumanYup'ikZimbabwean
Immigration
NonimmigrantsImmigrantsAfghanistanAfricaAlbaniaArgentinaArmeniaAsiaAustraliaAustriaBahamasBangladeshBarbadosBelarusBelgiumBelizeBoliviaBosnia and HerzegovinaBrazilBulgariaBurma/MyanmarCabo VerdeCambodiaCameroonCanadaCaribbeanCentral AmericaChileChinaColombiaCongoCosta RicaCroatiaCubaCzechoslovakiaDenmarkDominicaDominican RepublicEastern AfricaEastern AsiaEastern EuropeEcuadorEgyptEl SalvadorEnglandEritreaEthiopiaEuropeFijiFranceGermanyGhanaGreeceGrenadaGuatemalaGuyanaHaitiHondurasHong KongHungaryIndiaIndonesiaIranIraqIrelandIsraelItalyJamaicaJapanJordanKazakhstanKenyaKoreaKuwaitLaosLatin AmericaLatviaLebanonLiberiaLithuaniaMalaysiaMexicoMicronesiaMiddle AfricaMoldovaMoroccoNepalNetherlandsNicaraguaNigeriaNorth AmericaNorth MacedoniaNorthern AfricaNorthern EuropeNorwayOceaniaPakistanPanamaPeruPhilippinesPolandPortugalRomaniaRussiaSaudi ArabiaScotlandSenegalSerbiaSierra LeoneSingaporeSomaliaSouth AfricaSouth AmericaSouth Central AsiaSouth Eastern AsiaSouthern EuropeSpainSri LankaSt. Vincent and the GrenadinesSudanSwedenSwitzerlandSyriaTaiwanThailandTrinidad and TobagoTurkeyUgandaUkraineUruguayUzbekistanVenezuelaVietnamWest IndiesWestern AfricaWestern AsiaWestern EuropeYemenZaireZimbabweAzores
Child Poverty Under the Age of 16
Income
Poverty
Unemployment
Labor Participation
Family Structure
Vehicle Availability
Education Level
Disability

Child Poverty Under the Age of 16 Comparison

Aleuts

Whites/Caucasians

Poor
Average
17.1%
CHILD POVERTY UNDER THE AGE OF 16
13.9/ 100
METRIC RATING
205th/ 347
METRIC RANK
16.2%
CHILD POVERTY UNDER THE AGE OF 16
50.0/ 100
METRIC RATING
174th/ 347
METRIC RANK

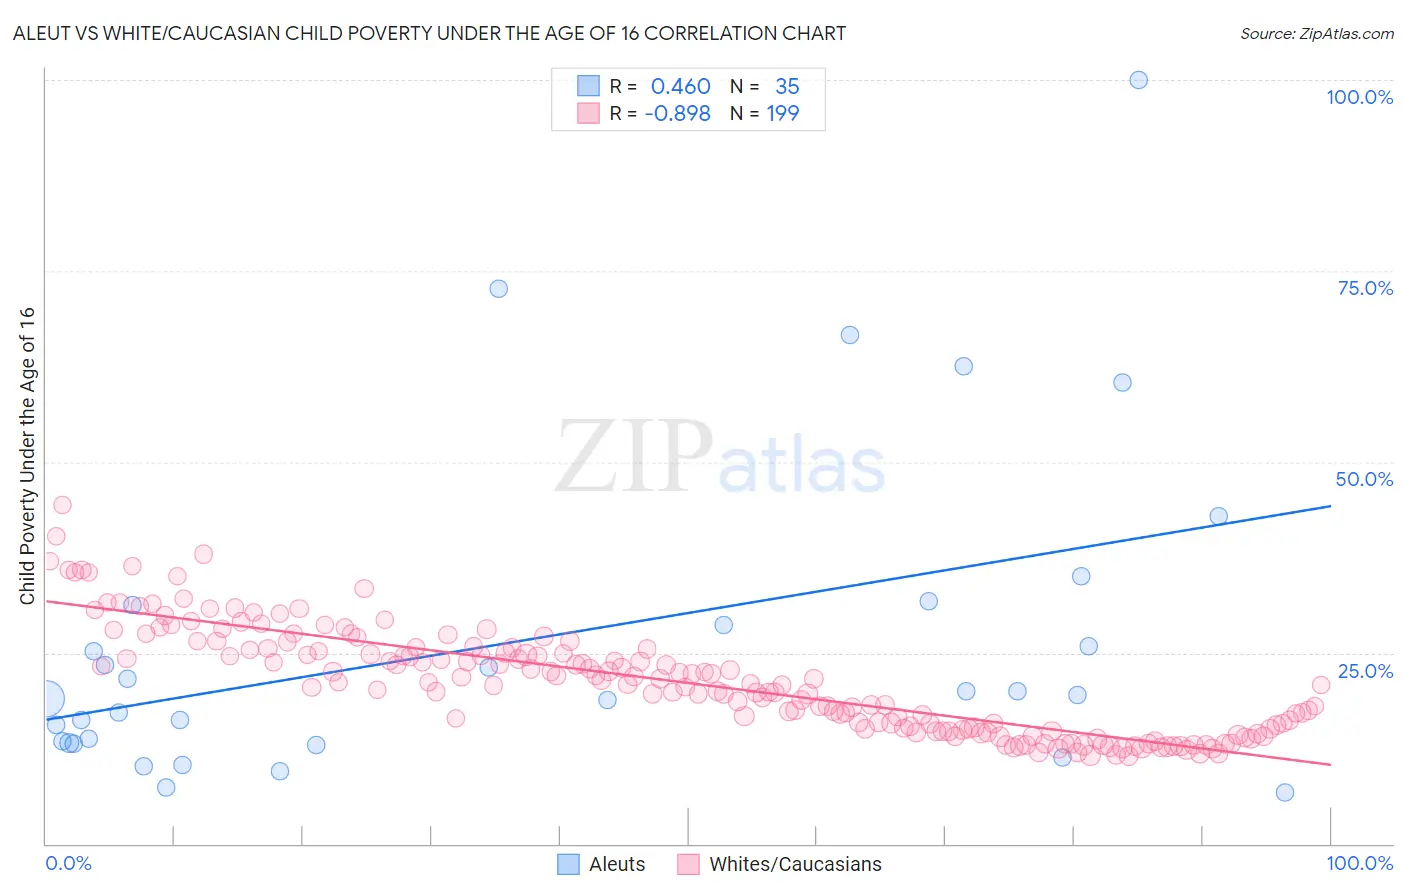
Aleut vs White/Caucasian Child Poverty Under the Age of 16 Correlation Chart

The statistical analysis conducted on geographies consisting of 61,640,515 people shows a moderate positive correlation between the proportion of Aleuts and poverty level among children under the age of 16 in the United States with a correlation coefficient (R) of 0.460 and weighted average of 17.1%. Similarly, the statistical analysis conducted on geographies consisting of 568,969,283 people shows a very strong negative correlation between the proportion of Whites/Caucasians and poverty level among children under the age of 16 in the United States with a correlation coefficient (R) of -0.898 and weighted average of 16.2%, a difference of 5.5%.
Aleut vs White/Caucasian Child Poverty Under the Age of 16

Child Poverty Under the Age of 16 Correlation Summary

MeasurementAleutWhite/Caucasian
Minimum6.7%11.5%
Maximum100.0%44.4%
Range93.3%32.8%
Mean26.7%21.1%
Median19.4%20.8%
Interquartile 25% (IQ1)13.2%15.0%
Interquartile 75% (IQ3)31.2%25.3%
Interquartile Range (IQR)18.1%10.4%
Standard Deviation (Sample)21.3%6.9%
Standard Deviation (Population)21.0%6.8%

Similar Demographics by Child Poverty Under the Age of 16

Demographics Similar to Aleuts by Child Poverty Under the Age of 16

In terms of child poverty under the age of 16, the demographic groups most similar to Aleuts are Hmong (17.1%, a difference of 0.010%), Immigrants from Sierra Leone (17.1%, a difference of 0.070%), Ugandan (17.1%, a difference of 0.090%), Immigrants from Uzbekistan (17.1%, a difference of 0.17%), and Immigrants from Cameroon (17.1%, a difference of 0.18%).
DemographicsRating | RankChild Poverty Under the Age of 16
Delaware
17.1
/100
|
#198
Poor
17.0%
Immigrants | Afghanistan
15.1
/100
|
#199
Poor
17.0%
Immigrants | Cameroon
14.7
/100
|
#200
Poor
17.1%
Immigrants | Uzbekistan
14.7
/100
|
#201
Poor
17.1%
Ugandans
14.3
/100
|
#202
Poor
17.1%
Immigrants | Sierra Leone
14.2
/100
|
#203
Poor
17.1%
Hmong
14.0
/100
|
#204
Poor
17.1%
Aleuts
13.9
/100
|
#205
Poor
17.1%
Alaska Natives
11.8
/100
|
#206
Poor
17.2%
German Russians
8.6
/100
|
#207
Tragic
17.4%
Pennsylvania Germans
7.5
/100
|
#208
Tragic
17.4%
Panamanians
6.9
/100
|
#209
Tragic
17.5%
Alaskan Athabascans
6.9
/100
|
#210
Tragic
17.5%
Immigrants | Thailand
6.6
/100
|
#211
Tragic
17.5%
Immigrants | Immigrants
6.5
/100
|
#212
Tragic
17.5%

Demographics Similar to Whites/Caucasians by Child Poverty Under the Age of 16

In terms of child poverty under the age of 16, the demographic groups most similar to Whites/Caucasians are Immigrants from Saudi Arabia (16.2%, a difference of 0.25%), Afghan (16.2%, a difference of 0.27%), Hungarian (16.2%, a difference of 0.30%), Scotch-Irish (16.3%, a difference of 0.34%), and Lebanese (16.3%, a difference of 0.50%).
DemographicsRating | RankChild Poverty Under the Age of 16
Costa Ricans
61.1
/100
|
#167
Good
16.0%
South Americans
57.9
/100
|
#168
Average
16.0%
Uruguayans
54.7
/100
|
#169
Average
16.1%
Immigrants | Colombia
54.4
/100
|
#170
Average
16.1%
Hungarians
52.5
/100
|
#171
Average
16.2%
Afghans
52.3
/100
|
#172
Average
16.2%
Immigrants | Saudi Arabia
52.1
/100
|
#173
Average
16.2%
Whites/Caucasians
50.0
/100
|
#174
Average
16.2%
Scotch-Irish
47.1
/100
|
#175
Average
16.3%
Lebanese
45.9
/100
|
#176
Average
16.3%
Ethiopians
43.4
/100
|
#177
Average
16.3%
Immigrants | Ethiopia
42.3
/100
|
#178
Average
16.4%
Immigrants | Syria
42.3
/100
|
#179
Average
16.4%
South American Indians
41.8
/100
|
#180
Average
16.4%
Immigrants | South America
40.8
/100
|
#181
Average
16.4%