Immigrants from Western Africa vs White/Caucasian Child Poverty Under the Age of 16
COMPARE
Immigrants from Western Africa
White/Caucasian
Child Poverty Under the Age of 16
Child Poverty Under the Age of 16 Comparison
Immigrants from Western Africa
Whites/Caucasians
19.2%
CHILD POVERTY UNDER THE AGE OF 16
0.2/ 100
METRIC RATING
254th/ 347
METRIC RANK
16.2%
CHILD POVERTY UNDER THE AGE OF 16
50.0/ 100
METRIC RATING
174th/ 347
METRIC RANK
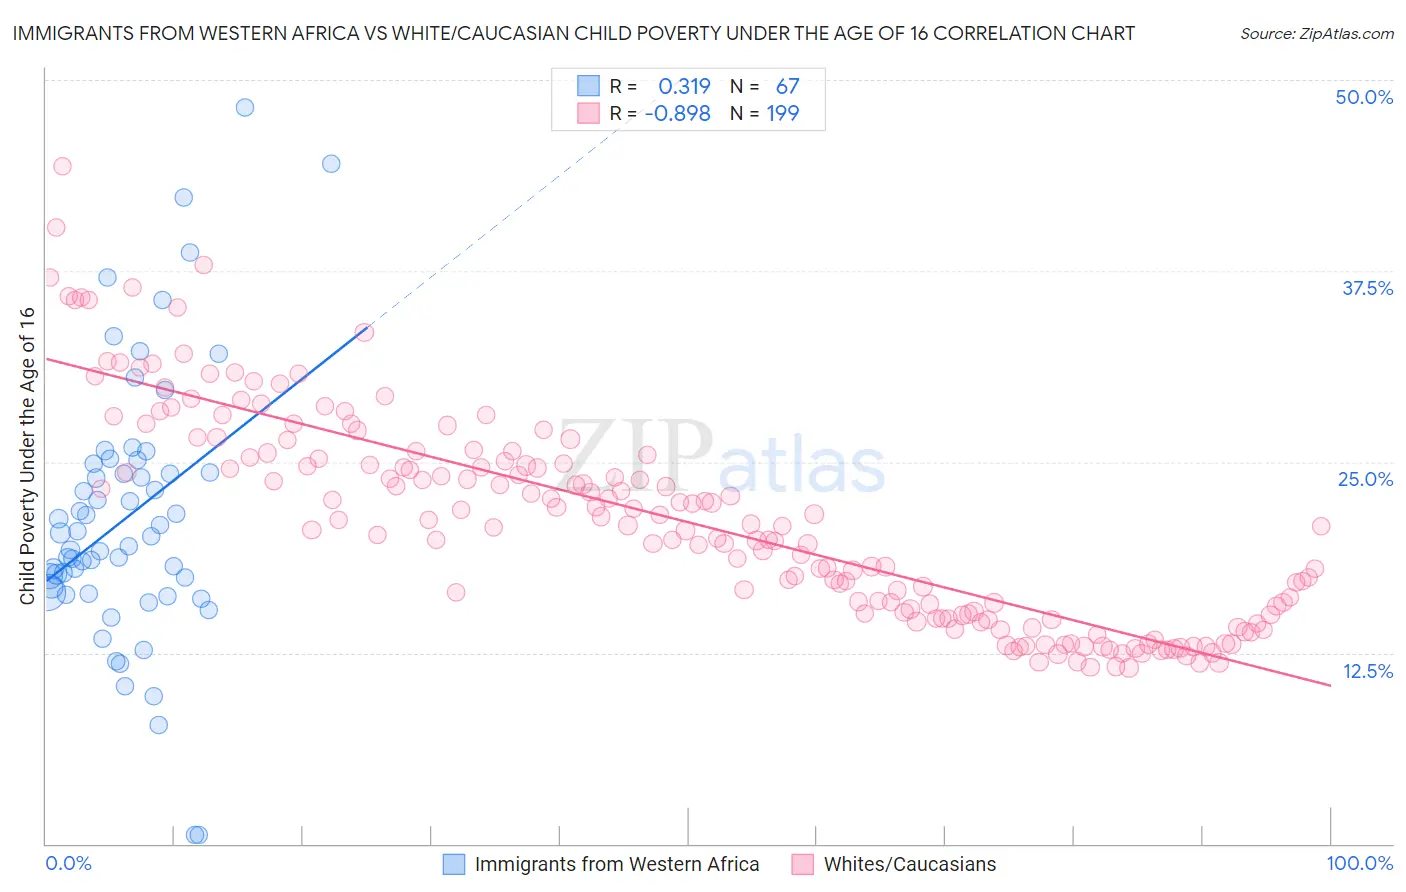
Immigrants from Western Africa vs White/Caucasian Child Poverty Under the Age of 16 Correlation Chart
The statistical analysis conducted on geographies consisting of 355,461,553 people shows a mild positive correlation between the proportion of Immigrants from Western Africa and poverty level among children under the age of 16 in the United States with a correlation coefficient (R) of 0.319 and weighted average of 19.2%. Similarly, the statistical analysis conducted on geographies consisting of 568,969,283 people shows a very strong negative correlation between the proportion of Whites/Caucasians and poverty level among children under the age of 16 in the United States with a correlation coefficient (R) of -0.898 and weighted average of 16.2%, a difference of 18.2%.
Child Poverty Under the Age of 16 Correlation Summary
| Measurement | Immigrants from Western Africa | White/Caucasian |
| Minimum | 0.58% | 11.5% |
| Maximum | 48.2% | 44.4% |
| Range | 47.6% | 32.8% |
| Mean | 21.4% | 21.1% |
| Median | 20.1% | 20.8% |
| Interquartile 25% (IQ1) | 16.5% | 15.0% |
| Interquartile 75% (IQ3) | 24.9% | 25.3% |
| Interquartile Range (IQR) | 8.4% | 10.4% |
| Standard Deviation (Sample) | 8.8% | 6.9% |
| Standard Deviation (Population) | 8.8% | 6.8% |
Similar Demographics by Child Poverty Under the Age of 16
Demographics Similar to Immigrants from Western Africa by Child Poverty Under the Age of 16
In terms of child poverty under the age of 16, the demographic groups most similar to Immigrants from Western Africa are Trinidadian and Tobagonian (19.2%, a difference of 0.17%), Salvadoran (19.1%, a difference of 0.25%), Inupiat (19.2%, a difference of 0.26%), Ottawa (19.2%, a difference of 0.27%), and Spanish American (19.2%, a difference of 0.35%).
| Demographics | Rating | Rank | Child Poverty Under the Age of 16 |
| French American Indians | 0.4 /100 | #247 | Tragic 18.9% |
| Ecuadorians | 0.3 /100 | #248 | Tragic 19.0% |
| Potawatomi | 0.3 /100 | #249 | Tragic 19.0% |
| Immigrants | Middle Africa | 0.3 /100 | #250 | Tragic 19.0% |
| Immigrants | Ghana | 0.3 /100 | #251 | Tragic 19.1% |
| Immigrants | Trinidad and Tobago | 0.3 /100 | #252 | Tragic 19.1% |
| Salvadorans | 0.3 /100 | #253 | Tragic 19.1% |
| Immigrants | Western Africa | 0.2 /100 | #254 | Tragic 19.2% |
| Trinidadians and Tobagonians | 0.2 /100 | #255 | Tragic 19.2% |
| Inupiat | 0.2 /100 | #256 | Tragic 19.2% |
| Ottawa | 0.2 /100 | #257 | Tragic 19.2% |
| Spanish Americans | 0.2 /100 | #258 | Tragic 19.2% |
| Mexican American Indians | 0.2 /100 | #259 | Tragic 19.3% |
| Guyanese | 0.2 /100 | #260 | Tragic 19.3% |
| Immigrants | Burma/Myanmar | 0.1 /100 | #261 | Tragic 19.4% |
Demographics Similar to Whites/Caucasians by Child Poverty Under the Age of 16
In terms of child poverty under the age of 16, the demographic groups most similar to Whites/Caucasians are Immigrants from Saudi Arabia (16.2%, a difference of 0.25%), Afghan (16.2%, a difference of 0.27%), Hungarian (16.2%, a difference of 0.30%), Scotch-Irish (16.3%, a difference of 0.34%), and Lebanese (16.3%, a difference of 0.50%).
| Demographics | Rating | Rank | Child Poverty Under the Age of 16 |
| Costa Ricans | 61.1 /100 | #167 | Good 16.0% |
| South Americans | 57.9 /100 | #168 | Average 16.0% |
| Uruguayans | 54.7 /100 | #169 | Average 16.1% |
| Immigrants | Colombia | 54.4 /100 | #170 | Average 16.1% |
| Hungarians | 52.5 /100 | #171 | Average 16.2% |
| Afghans | 52.3 /100 | #172 | Average 16.2% |
| Immigrants | Saudi Arabia | 52.1 /100 | #173 | Average 16.2% |
| Whites/Caucasians | 50.0 /100 | #174 | Average 16.2% |
| Scotch-Irish | 47.1 /100 | #175 | Average 16.3% |
| Lebanese | 45.9 /100 | #176 | Average 16.3% |
| Ethiopians | 43.4 /100 | #177 | Average 16.3% |
| Immigrants | Ethiopia | 42.3 /100 | #178 | Average 16.4% |
| Immigrants | Syria | 42.3 /100 | #179 | Average 16.4% |
| South American Indians | 41.8 /100 | #180 | Average 16.4% |
| Immigrants | South America | 40.8 /100 | #181 | Average 16.4% |