Asian vs White/Caucasian Child Poverty Under the Age of 16
COMPARE
Asian
White/Caucasian
Child Poverty Under the Age of 16
Child Poverty Under the Age of 16 Comparison
Asians
Whites/Caucasians
13.5%
CHILD POVERTY UNDER THE AGE OF 16
99.6/ 100
METRIC RATING
33rd/ 347
METRIC RANK
16.2%
CHILD POVERTY UNDER THE AGE OF 16
50.0/ 100
METRIC RATING
174th/ 347
METRIC RANK
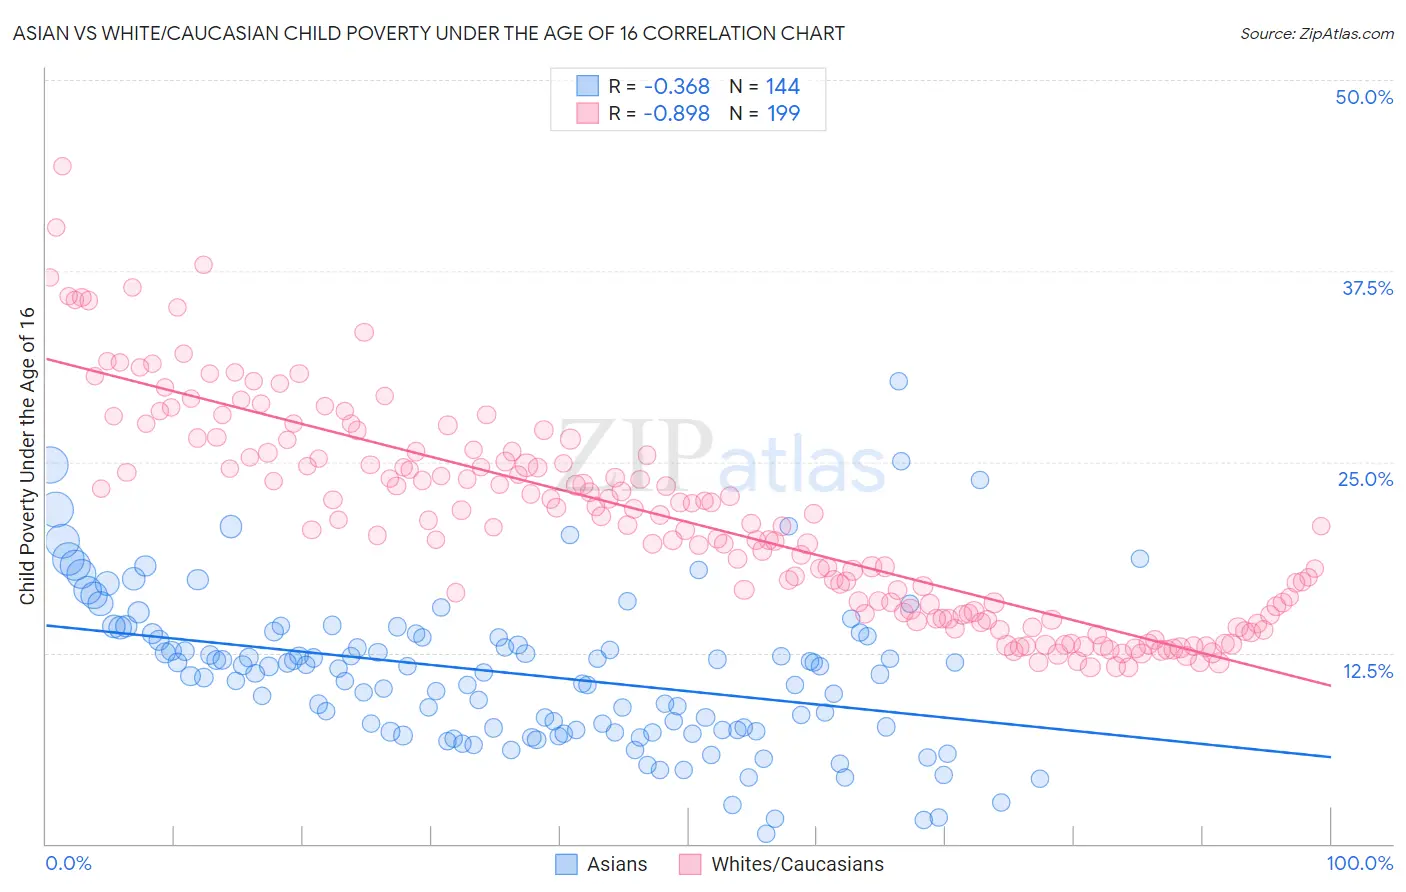
Asian vs White/Caucasian Child Poverty Under the Age of 16 Correlation Chart
The statistical analysis conducted on geographies consisting of 540,573,654 people shows a mild negative correlation between the proportion of Asians and poverty level among children under the age of 16 in the United States with a correlation coefficient (R) of -0.368 and weighted average of 13.5%. Similarly, the statistical analysis conducted on geographies consisting of 568,969,283 people shows a very strong negative correlation between the proportion of Whites/Caucasians and poverty level among children under the age of 16 in the United States with a correlation coefficient (R) of -0.898 and weighted average of 16.2%, a difference of 20.3%.
Child Poverty Under the Age of 16 Correlation Summary
| Measurement | Asian | White/Caucasian |
| Minimum | 0.65% | 11.5% |
| Maximum | 30.3% | 44.4% |
| Range | 29.6% | 32.8% |
| Mean | 11.2% | 21.1% |
| Median | 11.3% | 20.8% |
| Interquartile 25% (IQ1) | 7.4% | 15.0% |
| Interquartile 75% (IQ3) | 13.7% | 25.3% |
| Interquartile Range (IQR) | 6.2% | 10.4% |
| Standard Deviation (Sample) | 5.0% | 6.9% |
| Standard Deviation (Population) | 5.0% | 6.8% |
Similar Demographics by Child Poverty Under the Age of 16
Demographics Similar to Asians by Child Poverty Under the Age of 16
In terms of child poverty under the age of 16, the demographic groups most similar to Asians are Russian (13.5%, a difference of 0.28%), Lithuanian (13.5%, a difference of 0.48%), Tongan (13.4%, a difference of 0.49%), Danish (13.4%, a difference of 0.50%), and Turkish (13.4%, a difference of 0.71%).
| Demographics | Rating | Rank | Child Poverty Under the Age of 16 |
| Bolivians | 99.8 /100 | #26 | Exceptional 13.2% |
| Immigrants | China | 99.8 /100 | #27 | Exceptional 13.3% |
| Assyrians/Chaldeans/Syriacs | 99.7 /100 | #28 | Exceptional 13.3% |
| Swedes | 99.7 /100 | #29 | Exceptional 13.3% |
| Turks | 99.7 /100 | #30 | Exceptional 13.4% |
| Danes | 99.7 /100 | #31 | Exceptional 13.4% |
| Tongans | 99.7 /100 | #32 | Exceptional 13.4% |
| Asians | 99.6 /100 | #33 | Exceptional 13.5% |
| Russians | 99.6 /100 | #34 | Exceptional 13.5% |
| Lithuanians | 99.6 /100 | #35 | Exceptional 13.5% |
| Immigrants | Northern Europe | 99.6 /100 | #36 | Exceptional 13.6% |
| Immigrants | Bolivia | 99.6 /100 | #37 | Exceptional 13.6% |
| Luxembourgers | 99.5 /100 | #38 | Exceptional 13.6% |
| Immigrants | Australia | 99.5 /100 | #39 | Exceptional 13.6% |
| Immigrants | Scotland | 99.4 /100 | #40 | Exceptional 13.7% |
Demographics Similar to Whites/Caucasians by Child Poverty Under the Age of 16
In terms of child poverty under the age of 16, the demographic groups most similar to Whites/Caucasians are Immigrants from Saudi Arabia (16.2%, a difference of 0.25%), Afghan (16.2%, a difference of 0.27%), Hungarian (16.2%, a difference of 0.30%), Scotch-Irish (16.3%, a difference of 0.34%), and Lebanese (16.3%, a difference of 0.50%).
| Demographics | Rating | Rank | Child Poverty Under the Age of 16 |
| Costa Ricans | 61.1 /100 | #167 | Good 16.0% |
| South Americans | 57.9 /100 | #168 | Average 16.0% |
| Uruguayans | 54.7 /100 | #169 | Average 16.1% |
| Immigrants | Colombia | 54.4 /100 | #170 | Average 16.1% |
| Hungarians | 52.5 /100 | #171 | Average 16.2% |
| Afghans | 52.3 /100 | #172 | Average 16.2% |
| Immigrants | Saudi Arabia | 52.1 /100 | #173 | Average 16.2% |
| Whites/Caucasians | 50.0 /100 | #174 | Average 16.2% |
| Scotch-Irish | 47.1 /100 | #175 | Average 16.3% |
| Lebanese | 45.9 /100 | #176 | Average 16.3% |
| Ethiopians | 43.4 /100 | #177 | Average 16.3% |
| Immigrants | Ethiopia | 42.3 /100 | #178 | Average 16.4% |
| Immigrants | Syria | 42.3 /100 | #179 | Average 16.4% |
| South American Indians | 41.8 /100 | #180 | Average 16.4% |
| Immigrants | South America | 40.8 /100 | #181 | Average 16.4% |