Immigrants from Turkey vs Moroccan Child Poverty Among Boys Under 16
COMPARE
Immigrants from Turkey
Moroccan
Child Poverty Among Boys Under 16
Child Poverty Among Boys Under 16 Comparison
Immigrants from Turkey
Moroccans
14.6%
CHILD POVERTY AMONG BOYS UNDER 16
98.0/ 100
METRIC RATING
73rd/ 347
METRIC RANK
17.7%
CHILD POVERTY AMONG BOYS UNDER 16
5.6/ 100
METRIC RATING
216th/ 347
METRIC RANK
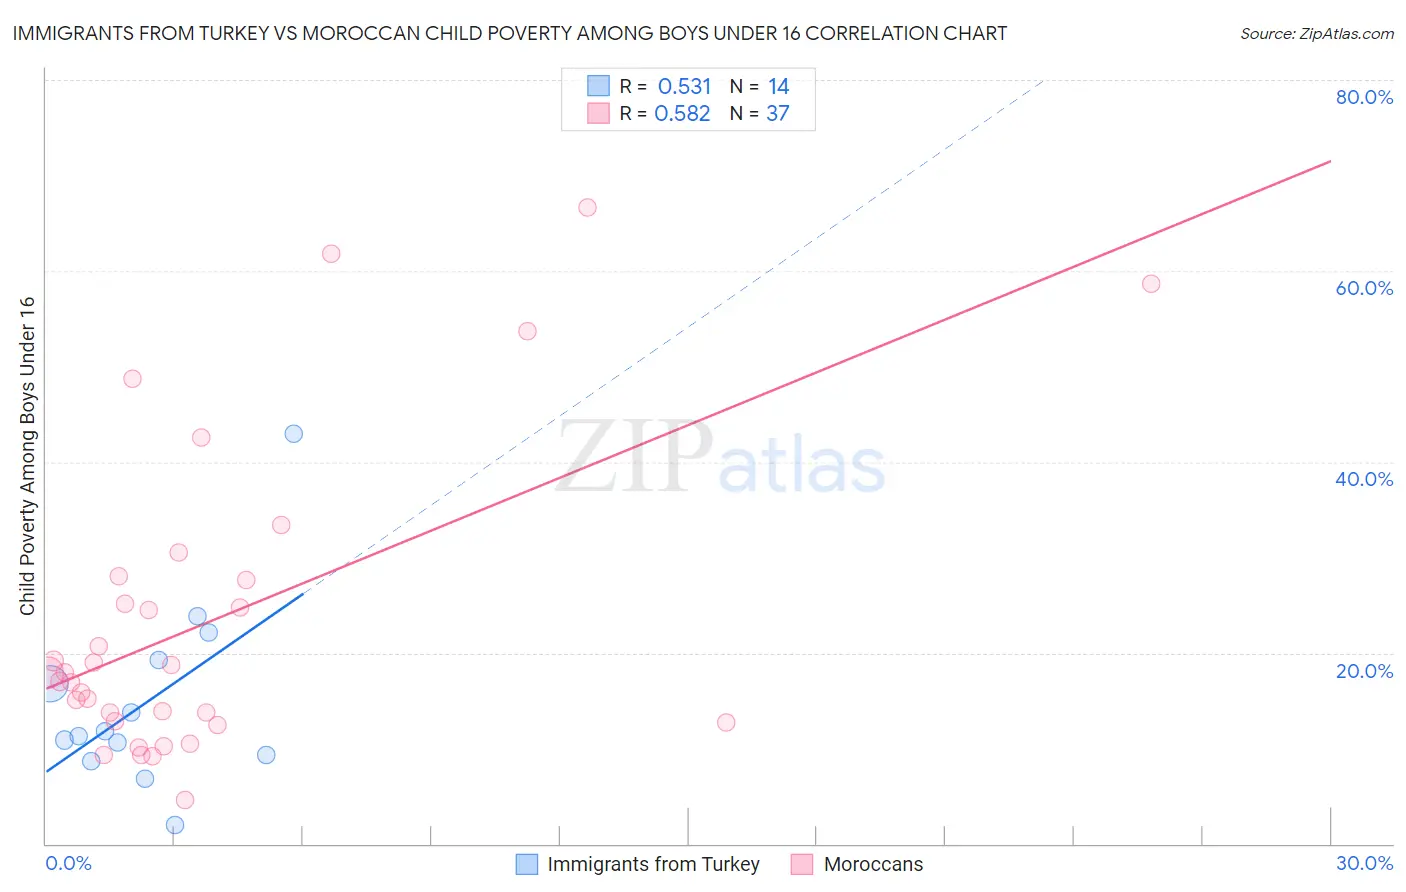
Immigrants from Turkey vs Moroccan Child Poverty Among Boys Under 16 Correlation Chart
The statistical analysis conducted on geographies consisting of 220,445,013 people shows a substantial positive correlation between the proportion of Immigrants from Turkey and poverty level among boys under the age of 16 in the United States with a correlation coefficient (R) of 0.531 and weighted average of 14.6%. Similarly, the statistical analysis conducted on geographies consisting of 200,157,995 people shows a substantial positive correlation between the proportion of Moroccans and poverty level among boys under the age of 16 in the United States with a correlation coefficient (R) of 0.582 and weighted average of 17.7%, a difference of 21.1%.
Child Poverty Among Boys Under 16 Correlation Summary
| Measurement | Immigrants from Turkey | Moroccan |
| Minimum | 1.9% | 4.6% |
| Maximum | 43.0% | 66.7% |
| Range | 41.0% | 62.1% |
| Mean | 15.0% | 23.3% |
| Median | 11.5% | 17.9% |
| Interquartile 25% (IQ1) | 9.3% | 12.8% |
| Interquartile 75% (IQ3) | 19.2% | 27.8% |
| Interquartile Range (IQR) | 10.0% | 15.1% |
| Standard Deviation (Sample) | 10.0% | 16.0% |
| Standard Deviation (Population) | 9.7% | 15.8% |
Similar Demographics by Child Poverty Among Boys Under 16
Demographics Similar to Immigrants from Turkey by Child Poverty Among Boys Under 16
In terms of child poverty among boys under 16, the demographic groups most similar to Immigrants from Turkey are Immigrants from Latvia (14.6%, a difference of 0.050%), Australian (14.7%, a difference of 0.050%), Immigrants from Netherlands (14.6%, a difference of 0.060%), Immigrants from Poland (14.7%, a difference of 0.12%), and Immigrants from Croatia (14.7%, a difference of 0.17%).
| Demographics | Rating | Rank | Child Poverty Among Boys Under 16 |
| Immigrants | Bulgaria | 98.5 /100 | #66 | Exceptional 14.5% |
| Immigrants | Europe | 98.4 /100 | #67 | Exceptional 14.5% |
| Slovenes | 98.4 /100 | #68 | Exceptional 14.5% |
| Immigrants | Austria | 98.4 /100 | #69 | Exceptional 14.5% |
| Europeans | 98.4 /100 | #70 | Exceptional 14.5% |
| Immigrants | Netherlands | 98.1 /100 | #71 | Exceptional 14.6% |
| Immigrants | Latvia | 98.1 /100 | #72 | Exceptional 14.6% |
| Immigrants | Turkey | 98.0 /100 | #73 | Exceptional 14.6% |
| Australians | 98.0 /100 | #74 | Exceptional 14.7% |
| Immigrants | Poland | 97.9 /100 | #75 | Exceptional 14.7% |
| Immigrants | Croatia | 97.9 /100 | #76 | Exceptional 14.7% |
| Macedonians | 97.9 /100 | #77 | Exceptional 14.7% |
| Egyptians | 97.8 /100 | #78 | Exceptional 14.7% |
| Immigrants | Eastern Europe | 97.8 /100 | #79 | Exceptional 14.7% |
| Immigrants | Russia | 97.7 /100 | #80 | Exceptional 14.7% |
Demographics Similar to Moroccans by Child Poverty Among Boys Under 16
In terms of child poverty among boys under 16, the demographic groups most similar to Moroccans are Japanese (17.7%, a difference of 0.030%), Iraqi (17.7%, a difference of 0.050%), Osage (17.7%, a difference of 0.090%), Sierra Leonean (17.8%, a difference of 0.13%), and Panamanian (17.7%, a difference of 0.16%).
| Demographics | Rating | Rank | Child Poverty Among Boys Under 16 |
| Alaskan Athabascans | 7.3 /100 | #209 | Tragic 17.6% |
| Immigrants | Armenia | 6.8 /100 | #210 | Tragic 17.6% |
| Immigrants | Immigrants | 6.7 /100 | #211 | Tragic 17.6% |
| Aleuts | 6.6 /100 | #212 | Tragic 17.7% |
| Immigrants | Eastern Africa | 6.0 /100 | #213 | Tragic 17.7% |
| Panamanians | 5.9 /100 | #214 | Tragic 17.7% |
| Osage | 5.8 /100 | #215 | Tragic 17.7% |
| Moroccans | 5.6 /100 | #216 | Tragic 17.7% |
| Japanese | 5.5 /100 | #217 | Tragic 17.7% |
| Iraqis | 5.5 /100 | #218 | Tragic 17.7% |
| Sierra Leoneans | 5.3 /100 | #219 | Tragic 17.8% |
| Immigrants | Cambodia | 5.1 /100 | #220 | Tragic 17.8% |
| Immigrants | Panama | 4.3 /100 | #221 | Tragic 17.9% |
| Pennsylvania Germans | 3.9 /100 | #222 | Tragic 17.9% |
| Cubans | 3.8 /100 | #223 | Tragic 17.9% |