Peruvian vs Mongolian Child Poverty Under the Age of 16
COMPARE
Peruvian
Mongolian
Child Poverty Under the Age of 16
Child Poverty Under the Age of 16 Comparison
Peruvians
Mongolians
15.3%
CHILD POVERTY UNDER THE AGE OF 16
87.2/ 100
METRIC RATING
137th/ 347
METRIC RANK
15.2%
CHILD POVERTY UNDER THE AGE OF 16
89.5/ 100
METRIC RATING
130th/ 347
METRIC RANK
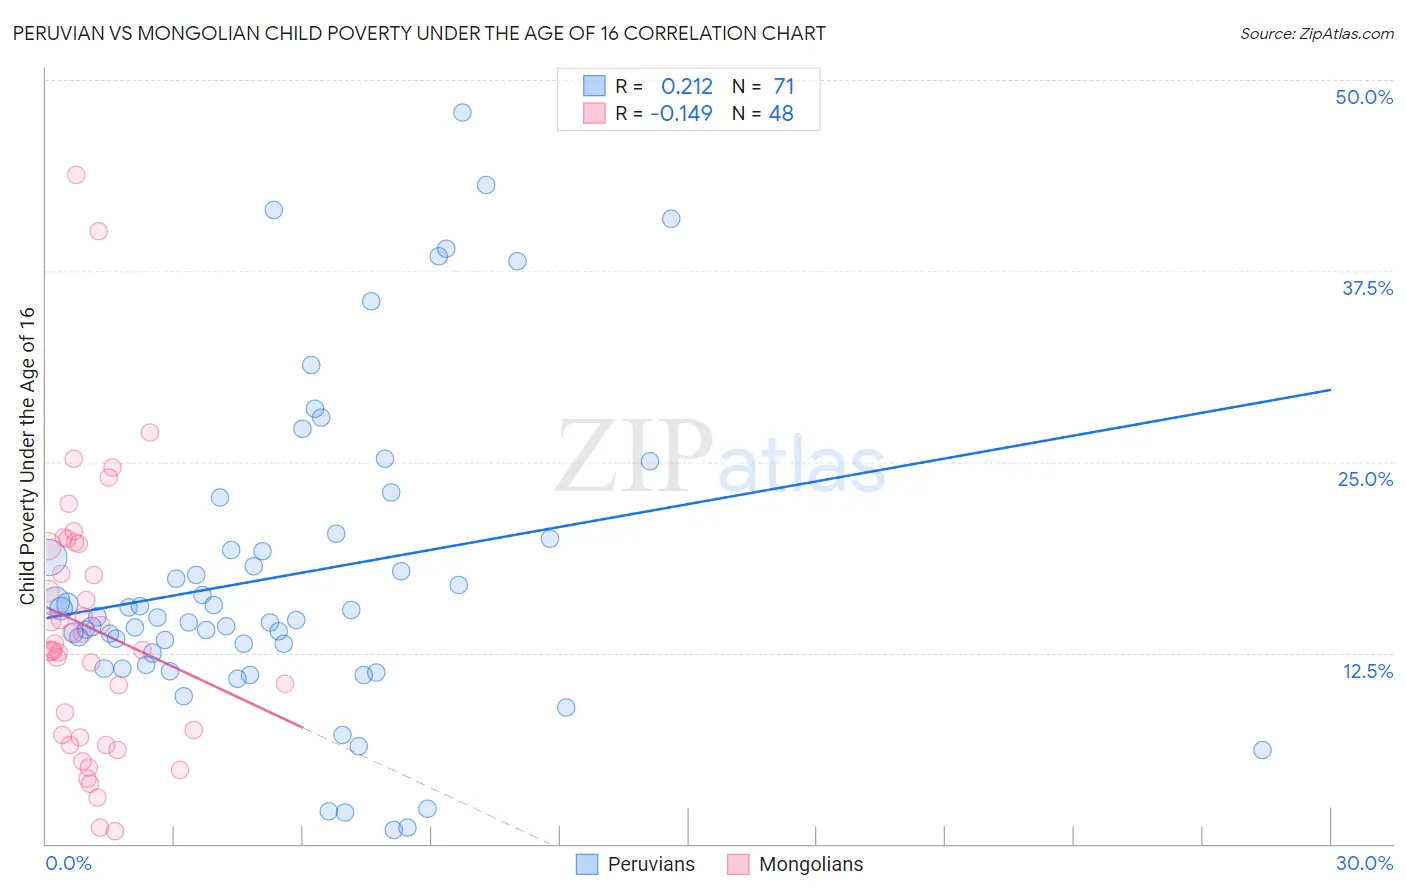
Peruvian vs Mongolian Child Poverty Under the Age of 16 Correlation Chart
The statistical analysis conducted on geographies consisting of 360,550,720 people shows a weak positive correlation between the proportion of Peruvians and poverty level among children under the age of 16 in the United States with a correlation coefficient (R) of 0.212 and weighted average of 15.3%. Similarly, the statistical analysis conducted on geographies consisting of 140,038,106 people shows a poor negative correlation between the proportion of Mongolians and poverty level among children under the age of 16 in the United States with a correlation coefficient (R) of -0.149 and weighted average of 15.2%, a difference of 0.70%.
Child Poverty Under the Age of 16 Correlation Summary
| Measurement | Peruvian | Mongolian |
| Minimum | 0.90% | 0.81% |
| Maximum | 47.9% | 43.8% |
| Range | 47.0% | 43.0% |
| Mean | 17.6% | 14.1% |
| Median | 14.8% | 12.9% |
| Interquartile 25% (IQ1) | 11.7% | 7.0% |
| Interquartile 75% (IQ3) | 20.0% | 19.6% |
| Interquartile Range (IQR) | 8.3% | 12.5% |
| Standard Deviation (Sample) | 10.3% | 8.8% |
| Standard Deviation (Population) | 10.2% | 8.7% |
Demographics Similar to Peruvians and Mongolians by Child Poverty Under the Age of 16
In terms of child poverty under the age of 16, the demographic groups most similar to Peruvians are Welsh (15.3%, a difference of 0.010%), Immigrants from Spain (15.3%, a difference of 0.030%), Immigrants from Vietnam (15.3%, a difference of 0.050%), New Zealander (15.3%, a difference of 0.11%), and Albanian (15.2%, a difference of 0.40%). Similarly, the demographic groups most similar to Mongolians are Armenian (15.2%, a difference of 0.030%), Immigrants from Southern Europe (15.1%, a difference of 0.10%), Canadian (15.2%, a difference of 0.12%), Immigrants from South Eastern Asia (15.2%, a difference of 0.17%), and Immigrants from Kazakhstan (15.1%, a difference of 0.25%).
| Demographics | Rating | Rank | Child Poverty Under the Age of 16 |
| Immigrants | Brazil | 91.1 /100 | #123 | Exceptional 15.1% |
| Czechoslovakians | 91.0 /100 | #124 | Exceptional 15.1% |
| Palestinians | 90.9 /100 | #125 | Exceptional 15.1% |
| Portuguese | 90.6 /100 | #126 | Exceptional 15.1% |
| Immigrants | Western Europe | 90.3 /100 | #127 | Exceptional 15.1% |
| Immigrants | Kazakhstan | 90.2 /100 | #128 | Exceptional 15.1% |
| Immigrants | Southern Europe | 89.7 /100 | #129 | Excellent 15.1% |
| Mongolians | 89.5 /100 | #130 | Excellent 15.2% |
| Armenians | 89.4 /100 | #131 | Excellent 15.2% |
| Canadians | 89.1 /100 | #132 | Excellent 15.2% |
| Immigrants | South Eastern Asia | 89.0 /100 | #133 | Excellent 15.2% |
| Native Hawaiians | 88.7 /100 | #134 | Excellent 15.2% |
| Albanians | 88.6 /100 | #135 | Excellent 15.2% |
| Immigrants | Spain | 87.3 /100 | #136 | Excellent 15.3% |
| Peruvians | 87.2 /100 | #137 | Excellent 15.3% |
| Welsh | 87.2 /100 | #138 | Excellent 15.3% |
| Immigrants | Vietnam | 87.1 /100 | #139 | Excellent 15.3% |
| New Zealanders | 86.9 /100 | #140 | Excellent 15.3% |
| Slavs | 84.2 /100 | #141 | Excellent 15.4% |
| Brazilians | 82.8 /100 | #142 | Excellent 15.4% |
| Icelanders | 82.5 /100 | #143 | Excellent 15.4% |