Immigrants from Kenya vs Laotian Single Male Poverty
COMPARE
Immigrants from Kenya
Laotian
Single Male Poverty
Single Male Poverty Comparison
Immigrants from Kenya
Laotians
12.5%
SINGLE MALE POVERTY
87.6/ 100
METRIC RATING
123rd/ 347
METRIC RANK
11.9%
SINGLE MALE POVERTY
99.6/ 100
METRIC RATING
65th/ 347
METRIC RANK
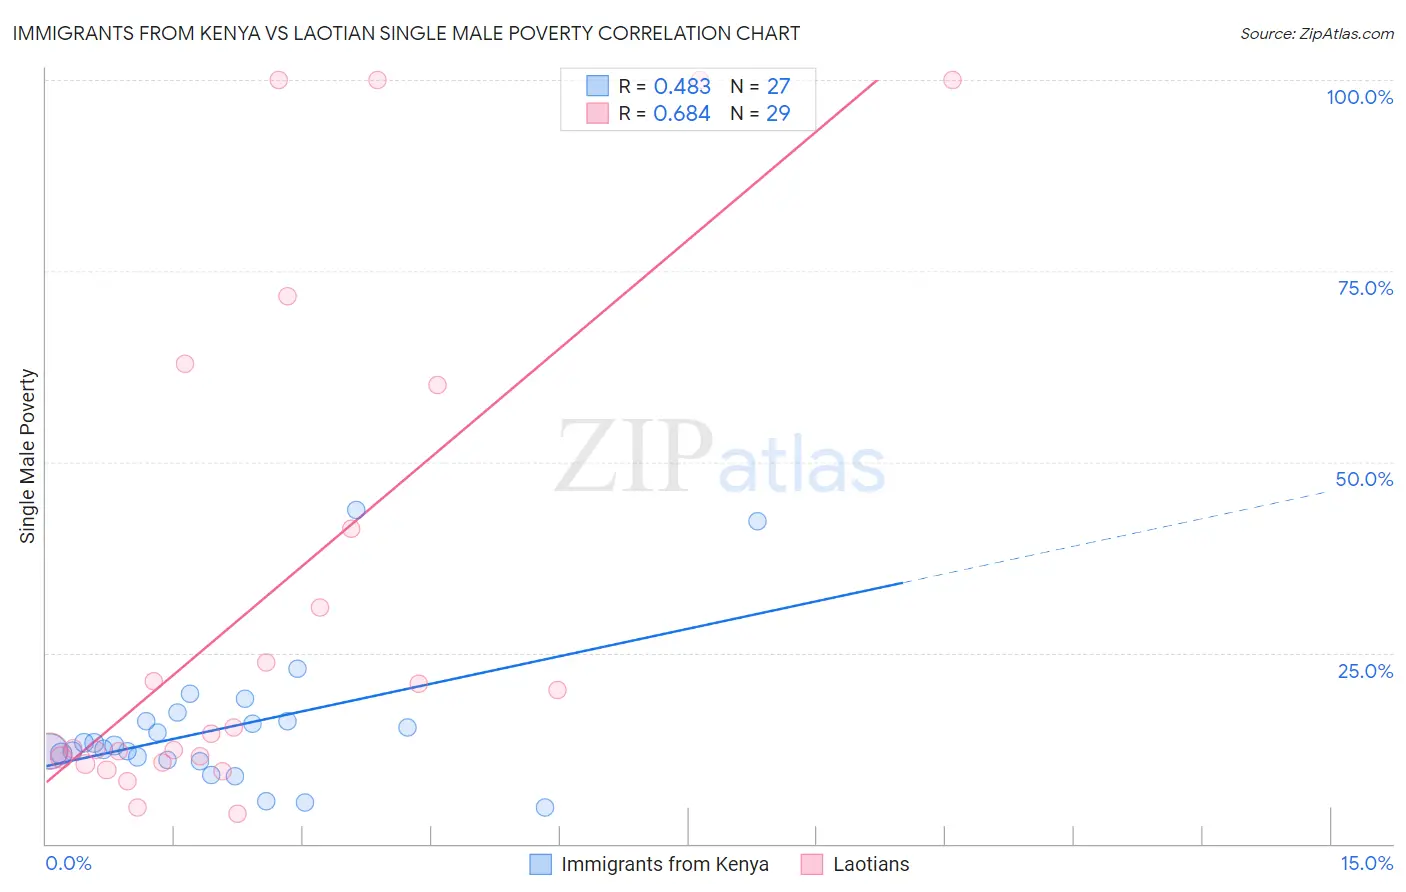
Immigrants from Kenya vs Laotian Single Male Poverty Correlation Chart
The statistical analysis conducted on geographies consisting of 201,857,660 people shows a moderate positive correlation between the proportion of Immigrants from Kenya and poverty level among single males in the United States with a correlation coefficient (R) of 0.483 and weighted average of 12.5%. Similarly, the statistical analysis conducted on geographies consisting of 207,953,623 people shows a significant positive correlation between the proportion of Laotians and poverty level among single males in the United States with a correlation coefficient (R) of 0.684 and weighted average of 11.9%, a difference of 5.1%.
Single Male Poverty Correlation Summary
| Measurement | Immigrants from Kenya | Laotian |
| Minimum | 4.8% | 3.9% |
| Maximum | 43.7% | 100.0% |
| Range | 38.9% | 96.1% |
| Mean | 15.1% | 31.9% |
| Median | 12.9% | 14.3% |
| Interquartile 25% (IQ1) | 10.9% | 11.0% |
| Interquartile 75% (IQ3) | 16.1% | 50.7% |
| Interquartile Range (IQR) | 5.2% | 39.7% |
| Standard Deviation (Sample) | 9.1% | 32.6% |
| Standard Deviation (Population) | 8.9% | 32.0% |
Similar Demographics by Single Male Poverty
Demographics Similar to Immigrants from Kenya by Single Male Poverty
In terms of single male poverty, the demographic groups most similar to Immigrants from Kenya are Russian (12.5%, a difference of 0.030%), Serbian (12.5%, a difference of 0.040%), Immigrants from Jordan (12.5%, a difference of 0.060%), Icelander (12.5%, a difference of 0.090%), and Romanian (12.5%, a difference of 0.14%).
| Demographics | Rating | Rank | Single Male Poverty |
| Immigrants | Syria | 91.2 /100 | #116 | Exceptional 12.4% |
| Immigrants | Oceania | 91.1 /100 | #117 | Exceptional 12.4% |
| Albanians | 90.6 /100 | #118 | Exceptional 12.4% |
| Immigrants | Albania | 90.3 /100 | #119 | Exceptional 12.4% |
| Venezuelans | 89.4 /100 | #120 | Excellent 12.4% |
| Icelanders | 88.2 /100 | #121 | Excellent 12.5% |
| Serbians | 87.9 /100 | #122 | Excellent 12.5% |
| Immigrants | Kenya | 87.6 /100 | #123 | Excellent 12.5% |
| Russians | 87.3 /100 | #124 | Excellent 12.5% |
| Immigrants | Jordan | 87.1 /100 | #125 | Excellent 12.5% |
| Romanians | 86.4 /100 | #126 | Excellent 12.5% |
| Immigrants | Netherlands | 86.2 /100 | #127 | Excellent 12.5% |
| Ecuadorians | 85.9 /100 | #128 | Excellent 12.5% |
| Immigrants | Sierra Leone | 85.5 /100 | #129 | Excellent 12.5% |
| Immigrants | Nicaragua | 84.8 /100 | #130 | Excellent 12.5% |
Demographics Similar to Laotians by Single Male Poverty
In terms of single male poverty, the demographic groups most similar to Laotians are Immigrants from Uruguay (11.9%, a difference of 0.0%), Immigrants from Ukraine (11.9%, a difference of 0.020%), Immigrants from Croatia (11.9%, a difference of 0.030%), Immigrants from Russia (11.9%, a difference of 0.060%), and Immigrants from Nepal (11.9%, a difference of 0.080%).
| Demographics | Rating | Rank | Single Male Poverty |
| Immigrants | Brazil | 99.8 /100 | #58 | Exceptional 11.7% |
| Brazilians | 99.8 /100 | #59 | Exceptional 11.8% |
| Peruvians | 99.8 /100 | #60 | Exceptional 11.8% |
| Cambodians | 99.8 /100 | #61 | Exceptional 11.8% |
| Immigrants | Sri Lanka | 99.7 /100 | #62 | Exceptional 11.8% |
| Immigrants | Belarus | 99.7 /100 | #63 | Exceptional 11.8% |
| Immigrants | Eastern Europe | 99.6 /100 | #64 | Exceptional 11.8% |
| Laotians | 99.6 /100 | #65 | Exceptional 11.9% |
| Immigrants | Uruguay | 99.6 /100 | #66 | Exceptional 11.9% |
| Immigrants | Ukraine | 99.6 /100 | #67 | Exceptional 11.9% |
| Immigrants | Croatia | 99.6 /100 | #68 | Exceptional 11.9% |
| Immigrants | Russia | 99.6 /100 | #69 | Exceptional 11.9% |
| Immigrants | Nepal | 99.6 /100 | #70 | Exceptional 11.9% |
| Immigrants | Greece | 99.6 /100 | #71 | Exceptional 11.9% |
| Immigrants | Argentina | 99.5 /100 | #72 | Exceptional 11.9% |