Potawatomi vs Immigrants from Burma/Myanmar Child Poverty Under the Age of 16
COMPARE
Potawatomi
Immigrants from Burma/Myanmar
Child Poverty Under the Age of 16
Child Poverty Under the Age of 16 Comparison
Potawatomi
Immigrants from Burma/Myanmar
19.0%
CHILD POVERTY UNDER THE AGE OF 16
0.3/ 100
METRIC RATING
249th/ 347
METRIC RANK
19.4%
CHILD POVERTY UNDER THE AGE OF 16
0.1/ 100
METRIC RATING
261st/ 347
METRIC RANK
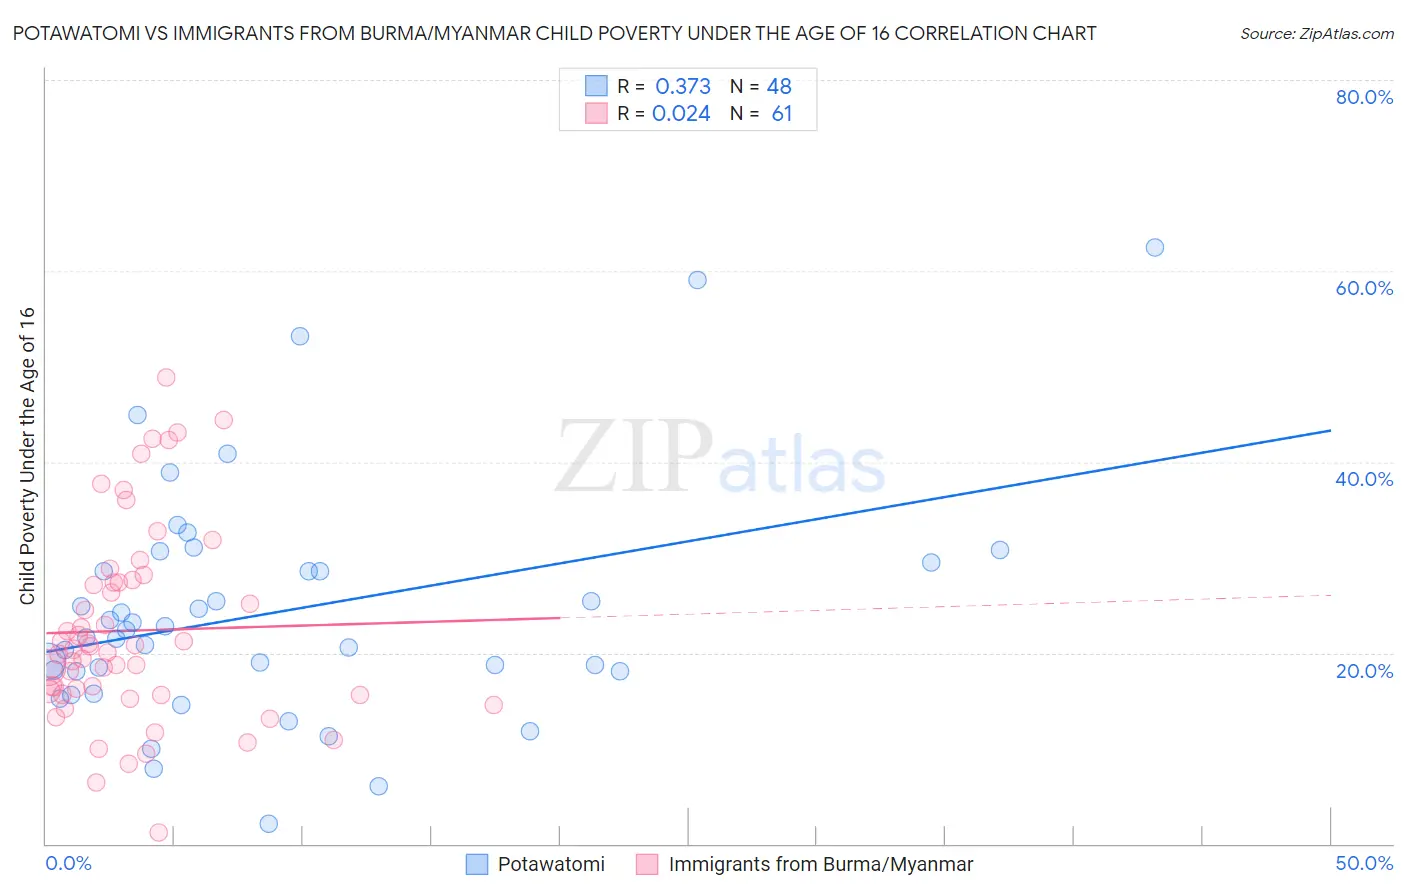
Potawatomi vs Immigrants from Burma/Myanmar Child Poverty Under the Age of 16 Correlation Chart
The statistical analysis conducted on geographies consisting of 117,473,680 people shows a mild positive correlation between the proportion of Potawatomi and poverty level among children under the age of 16 in the United States with a correlation coefficient (R) of 0.373 and weighted average of 19.0%. Similarly, the statistical analysis conducted on geographies consisting of 171,826,870 people shows no correlation between the proportion of Immigrants from Burma/Myanmar and poverty level among children under the age of 16 in the United States with a correlation coefficient (R) of 0.024 and weighted average of 19.4%, a difference of 2.0%.
Child Poverty Under the Age of 16 Correlation Summary
| Measurement | Potawatomi | Immigrants from Burma/Myanmar |
| Minimum | 2.0% | 1.2% |
| Maximum | 62.5% | 48.9% |
| Range | 60.5% | 47.6% |
| Mean | 24.3% | 22.3% |
| Median | 21.9% | 20.4% |
| Interquartile 25% (IQ1) | 18.1% | 15.6% |
| Interquartile 75% (IQ3) | 29.0% | 27.5% |
| Interquartile Range (IQR) | 10.9% | 11.9% |
| Standard Deviation (Sample) | 12.4% | 10.2% |
| Standard Deviation (Population) | 12.2% | 10.1% |
Demographics Similar to Potawatomi and Immigrants from Burma/Myanmar by Child Poverty Under the Age of 16
In terms of child poverty under the age of 16, the demographic groups most similar to Potawatomi are Ecuadorian (19.0%, a difference of 0.19%), Immigrants from Middle Africa (19.0%, a difference of 0.20%), Immigrants from Ghana (19.1%, a difference of 0.36%), Immigrants from Trinidad and Tobago (19.1%, a difference of 0.43%), and French American Indian (18.9%, a difference of 0.61%). Similarly, the demographic groups most similar to Immigrants from Burma/Myanmar are Immigrants from Guyana (19.4%, a difference of 0.040%), Guyanese (19.3%, a difference of 0.080%), Mexican American Indian (19.3%, a difference of 0.18%), Vietnamese (19.4%, a difference of 0.36%), and Immigrants from Ecuador (19.4%, a difference of 0.42%).
| Demographics | Rating | Rank | Child Poverty Under the Age of 16 |
| Shoshone | 0.5 /100 | #245 | Tragic 18.8% |
| Immigrants | Nicaragua | 0.4 /100 | #246 | Tragic 18.8% |
| French American Indians | 0.4 /100 | #247 | Tragic 18.9% |
| Ecuadorians | 0.3 /100 | #248 | Tragic 19.0% |
| Potawatomi | 0.3 /100 | #249 | Tragic 19.0% |
| Immigrants | Middle Africa | 0.3 /100 | #250 | Tragic 19.0% |
| Immigrants | Ghana | 0.3 /100 | #251 | Tragic 19.1% |
| Immigrants | Trinidad and Tobago | 0.3 /100 | #252 | Tragic 19.1% |
| Salvadorans | 0.3 /100 | #253 | Tragic 19.1% |
| Immigrants | Western Africa | 0.2 /100 | #254 | Tragic 19.2% |
| Trinidadians and Tobagonians | 0.2 /100 | #255 | Tragic 19.2% |
| Inupiat | 0.2 /100 | #256 | Tragic 19.2% |
| Ottawa | 0.2 /100 | #257 | Tragic 19.2% |
| Spanish Americans | 0.2 /100 | #258 | Tragic 19.2% |
| Mexican American Indians | 0.2 /100 | #259 | Tragic 19.3% |
| Guyanese | 0.2 /100 | #260 | Tragic 19.3% |
| Immigrants | Burma/Myanmar | 0.1 /100 | #261 | Tragic 19.4% |
| Immigrants | Guyana | 0.1 /100 | #262 | Tragic 19.4% |
| Vietnamese | 0.1 /100 | #263 | Tragic 19.4% |
| Immigrants | Ecuador | 0.1 /100 | #264 | Tragic 19.4% |
| Chickasaw | 0.1 /100 | #265 | Tragic 19.5% |