Tlingit-Haida vs Immigrants from Asia 9th Grade
COMPARE
Tlingit-Haida
Immigrants from Asia
9th Grade
9th Grade Comparison
Tlingit-Haida
Immigrants from Asia
96.6%
9TH GRADE
100.0/ 100
METRIC RATING
9th/ 347
METRIC RANK
94.4%
9TH GRADE
7.7/ 100
METRIC RATING
222nd/ 347
METRIC RANK
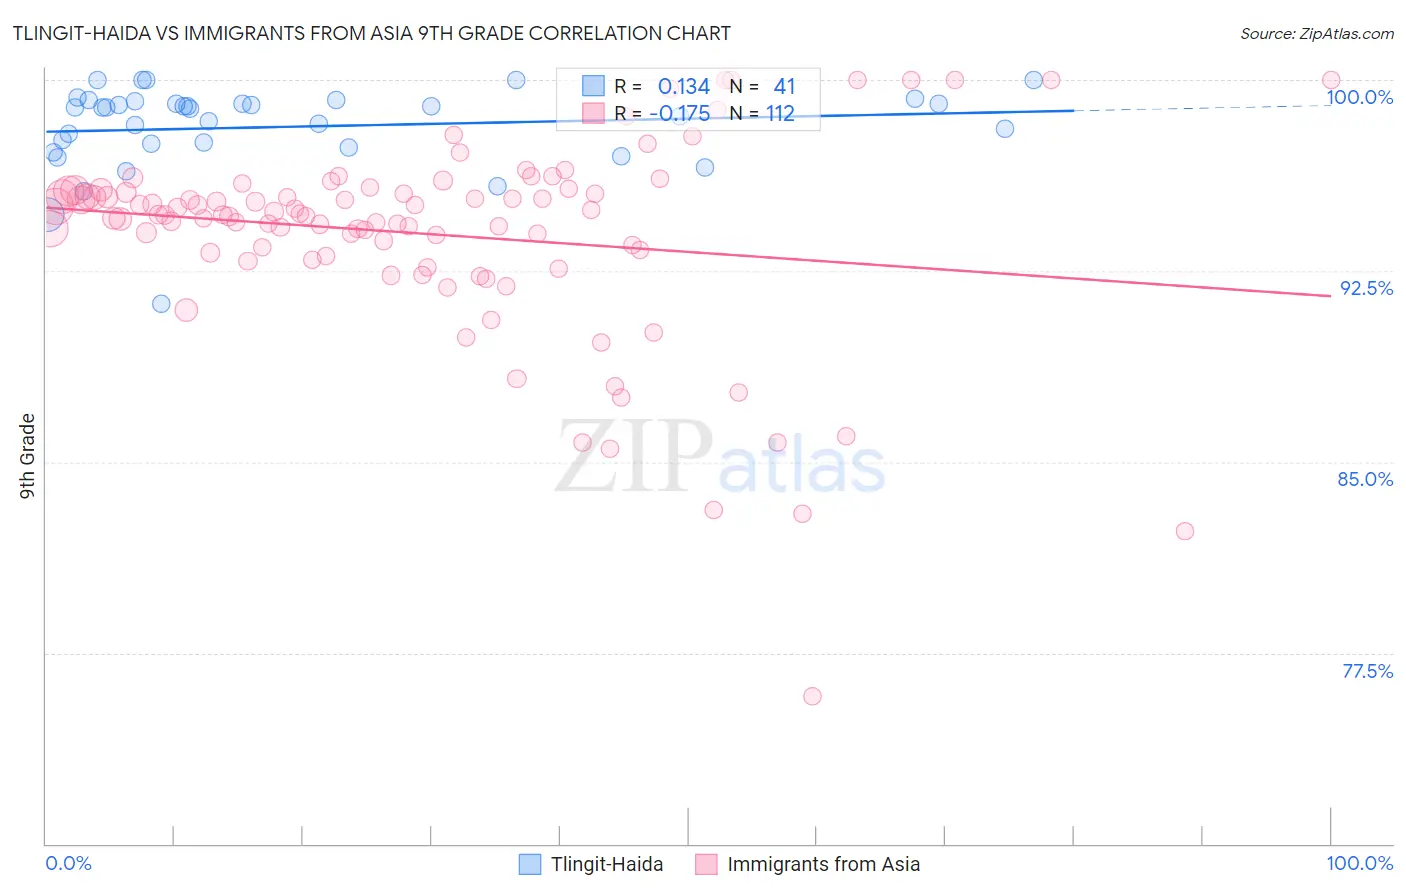
Tlingit-Haida vs Immigrants from Asia 9th Grade Correlation Chart
The statistical analysis conducted on geographies consisting of 60,871,919 people shows a poor positive correlation between the proportion of Tlingit-Haida and percentage of population with at least 9th grade education in the United States with a correlation coefficient (R) of 0.134 and weighted average of 96.6%. Similarly, the statistical analysis conducted on geographies consisting of 549,167,442 people shows a poor negative correlation between the proportion of Immigrants from Asia and percentage of population with at least 9th grade education in the United States with a correlation coefficient (R) of -0.175 and weighted average of 94.4%, a difference of 2.3%.
9th Grade Correlation Summary
| Measurement | Tlingit-Haida | Immigrants from Asia |
| Minimum | 91.2% | 75.8% |
| Maximum | 100.0% | 100.0% |
| Range | 8.8% | 24.2% |
| Mean | 98.2% | 93.9% |
| Median | 98.9% | 94.7% |
| Interquartile 25% (IQ1) | 97.4% | 93.1% |
| Interquartile 75% (IQ3) | 99.1% | 95.7% |
| Interquartile Range (IQR) | 1.7% | 2.5% |
| Standard Deviation (Sample) | 1.7% | 3.9% |
| Standard Deviation (Population) | 1.7% | 3.9% |
Similar Demographics by 9th Grade
Demographics Similar to Tlingit-Haida by 9th Grade
In terms of 9th grade, the demographic groups most similar to Tlingit-Haida are Lithuanian (96.6%, a difference of 0.040%), Finnish (96.6%, a difference of 0.040%), English (96.6%, a difference of 0.060%), German (96.7%, a difference of 0.080%), and Carpatho Rusyn (96.7%, a difference of 0.090%).
| Demographics | Rating | Rank | 9th Grade |
| Norwegians | 100.0 /100 | #2 | Exceptional 96.9% |
| Slovaks | 100.0 /100 | #3 | Exceptional 96.9% |
| Slovenes | 100.0 /100 | #4 | Exceptional 96.7% |
| Swedes | 100.0 /100 | #5 | Exceptional 96.7% |
| Poles | 100.0 /100 | #6 | Exceptional 96.7% |
| Carpatho Rusyns | 100.0 /100 | #7 | Exceptional 96.7% |
| Germans | 100.0 /100 | #8 | Exceptional 96.7% |
| Tlingit-Haida | 100.0 /100 | #9 | Exceptional 96.6% |
| Lithuanians | 100.0 /100 | #10 | Exceptional 96.6% |
| Finns | 100.0 /100 | #11 | Exceptional 96.6% |
| English | 100.0 /100 | #12 | Exceptional 96.6% |
| Danes | 100.0 /100 | #13 | Exceptional 96.5% |
| Scottish | 100.0 /100 | #14 | Exceptional 96.5% |
| Irish | 100.0 /100 | #15 | Exceptional 96.5% |
| Croatians | 100.0 /100 | #16 | Exceptional 96.5% |
Demographics Similar to Immigrants from Asia by 9th Grade
In terms of 9th grade, the demographic groups most similar to Immigrants from Asia are Immigrants from Eastern Africa (94.5%, a difference of 0.010%), Indian (Asian) (94.5%, a difference of 0.020%), Bahamian (94.4%, a difference of 0.020%), African (94.5%, a difference of 0.030%), and Portuguese (94.5%, a difference of 0.040%).
| Demographics | Rating | Rank | 9th Grade |
| Immigrants | Syria | 11.0 /100 | #215 | Poor 94.5% |
| Immigrants | Western Asia | 10.7 /100 | #216 | Poor 94.5% |
| Asians | 9.9 /100 | #217 | Tragic 94.5% |
| Portuguese | 9.2 /100 | #218 | Tragic 94.5% |
| Africans | 9.0 /100 | #219 | Tragic 94.5% |
| Indians (Asian) | 8.6 /100 | #220 | Tragic 94.5% |
| Immigrants | Eastern Africa | 8.2 /100 | #221 | Tragic 94.5% |
| Immigrants | Asia | 7.7 /100 | #222 | Tragic 94.4% |
| Bahamians | 7.0 /100 | #223 | Tragic 94.4% |
| Tongans | 6.0 /100 | #224 | Tragic 94.4% |
| Ethiopians | 5.4 /100 | #225 | Tragic 94.4% |
| Sub-Saharan Africans | 5.4 /100 | #226 | Tragic 94.4% |
| Immigrants | Sierra Leone | 4.8 /100 | #227 | Tragic 94.4% |
| Lumbee | 4.7 /100 | #228 | Tragic 94.4% |
| Immigrants | Southern Europe | 4.5 /100 | #229 | Tragic 94.3% |