Tlingit-Haida vs Immigrants from Asia Receiving Food Stamps
COMPARE
Tlingit-Haida
Immigrants from Asia
Receiving Food Stamps
Receiving Food Stamps Comparison
Tlingit-Haida
Immigrants from Asia
11.6%
RECEIVING FOOD STAMPS
59.1/ 100
METRIC RATING
168th/ 347
METRIC RANK
9.9%
RECEIVING FOOD STAMPS
98.9/ 100
METRIC RATING
72nd/ 347
METRIC RANK
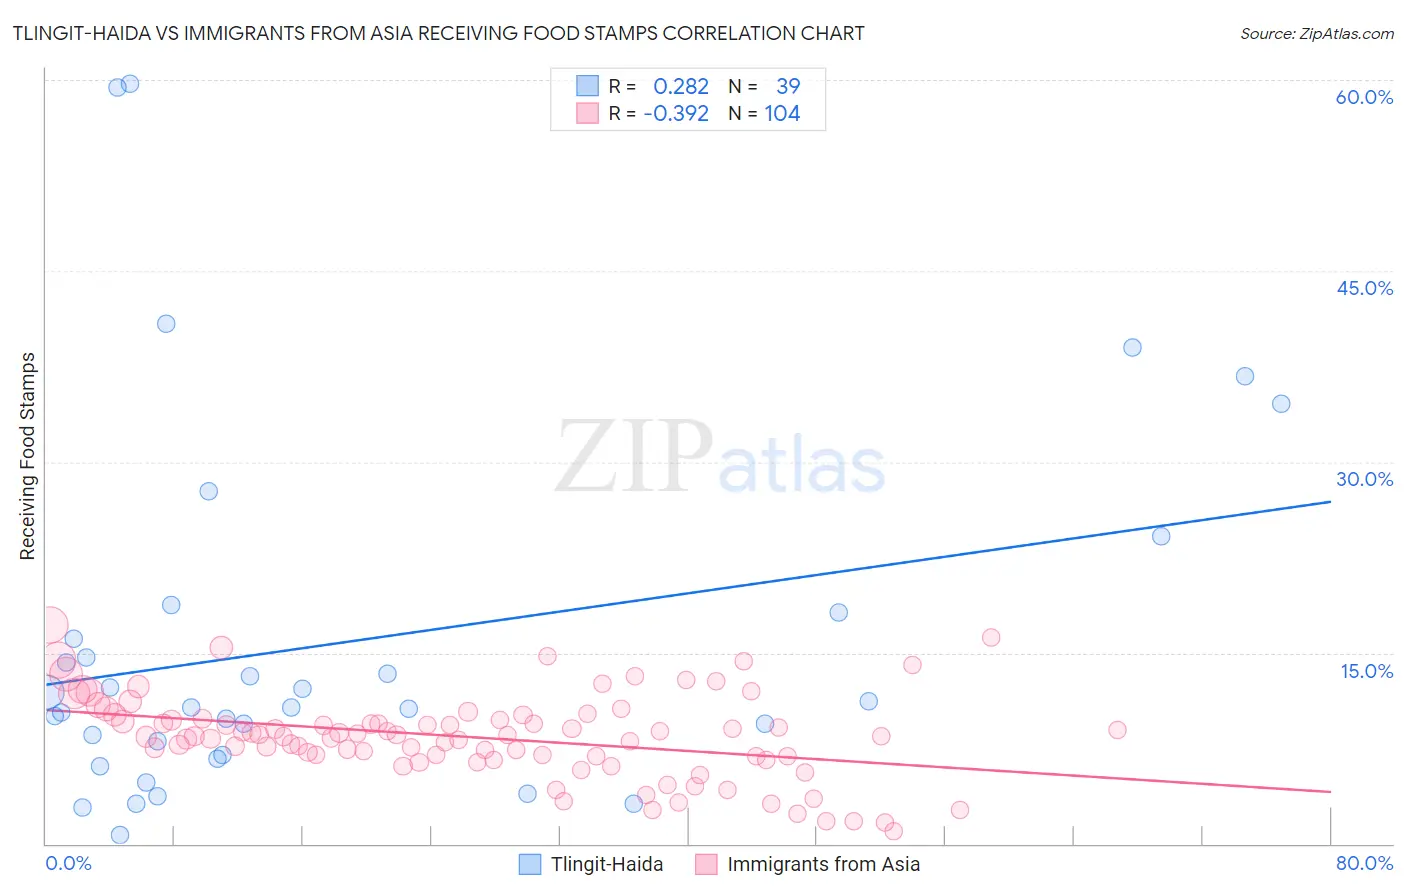
Tlingit-Haida vs Immigrants from Asia Receiving Food Stamps Correlation Chart
The statistical analysis conducted on geographies consisting of 60,831,023 people shows a weak positive correlation between the proportion of Tlingit-Haida and percentage of population receiving government assistance and/or food stamps in the United States with a correlation coefficient (R) of 0.282 and weighted average of 11.6%. Similarly, the statistical analysis conducted on geographies consisting of 546,090,364 people shows a mild negative correlation between the proportion of Immigrants from Asia and percentage of population receiving government assistance and/or food stamps in the United States with a correlation coefficient (R) of -0.392 and weighted average of 9.9%, a difference of 17.1%.
Receiving Food Stamps Correlation Summary
| Measurement | Tlingit-Haida | Immigrants from Asia |
| Minimum | 0.70% | 1.0% |
| Maximum | 59.7% | 17.2% |
| Range | 59.0% | 16.2% |
| Mean | 15.8% | 8.4% |
| Median | 10.7% | 8.4% |
| Interquartile 25% (IQ1) | 7.0% | 6.9% |
| Interquartile 75% (IQ3) | 18.2% | 9.8% |
| Interquartile Range (IQR) | 11.2% | 2.9% |
| Standard Deviation (Sample) | 14.4% | 3.3% |
| Standard Deviation (Population) | 14.2% | 3.3% |
Similar Demographics by Receiving Food Stamps
Demographics Similar to Tlingit-Haida by Receiving Food Stamps
In terms of receiving food stamps, the demographic groups most similar to Tlingit-Haida are Immigrants from Eastern Africa (11.6%, a difference of 0.12%), Kenyan (11.6%, a difference of 0.16%), Costa Rican (11.6%, a difference of 0.18%), Immigrants from Western Asia (11.6%, a difference of 0.40%), and Immigrants from Belarus (11.5%, a difference of 0.54%).
| Demographics | Rating | Rank | Receiving Food Stamps |
| Pennsylvania Germans | 68.4 /100 | #161 | Good 11.4% |
| Alsatians | 68.0 /100 | #162 | Good 11.4% |
| Immigrants | Southern Europe | 65.8 /100 | #163 | Good 11.5% |
| Immigrants | Chile | 65.0 /100 | #164 | Good 11.5% |
| Arabs | 64.7 /100 | #165 | Good 11.5% |
| Immigrants | Belarus | 62.8 /100 | #166 | Good 11.5% |
| Kenyans | 60.2 /100 | #167 | Good 11.6% |
| Tlingit-Haida | 59.1 /100 | #168 | Average 11.6% |
| Immigrants | Eastern Africa | 58.3 /100 | #169 | Average 11.6% |
| Costa Ricans | 57.9 /100 | #170 | Average 11.6% |
| Immigrants | Western Asia | 56.4 /100 | #171 | Average 11.6% |
| Guamanians/Chamorros | 54.2 /100 | #172 | Average 11.7% |
| Immigrants | Syria | 53.4 /100 | #173 | Average 11.7% |
| Immigrants | Eritrea | 50.0 /100 | #174 | Average 11.7% |
| Osage | 49.8 /100 | #175 | Average 11.7% |
Demographics Similar to Immigrants from Asia by Receiving Food Stamps
In terms of receiving food stamps, the demographic groups most similar to Immigrants from Asia are Macedonian (9.9%, a difference of 0.060%), New Zealander (9.9%, a difference of 0.23%), Scottish (9.9%, a difference of 0.24%), Immigrants from Serbia (9.9%, a difference of 0.37%), and Italian (9.9%, a difference of 0.42%).
| Demographics | Rating | Rank | Receiving Food Stamps |
| Immigrants | Turkey | 99.1 /100 | #65 | Exceptional 9.8% |
| Slovenes | 99.1 /100 | #66 | Exceptional 9.8% |
| Immigrants | Indonesia | 99.0 /100 | #67 | Exceptional 9.8% |
| Northern Europeans | 99.0 /100 | #68 | Exceptional 9.8% |
| Italians | 99.0 /100 | #69 | Exceptional 9.9% |
| Immigrants | Serbia | 99.0 /100 | #70 | Exceptional 9.9% |
| Scottish | 98.9 /100 | #71 | Exceptional 9.9% |
| Immigrants | Asia | 98.9 /100 | #72 | Exceptional 9.9% |
| Macedonians | 98.9 /100 | #73 | Exceptional 9.9% |
| New Zealanders | 98.8 /100 | #74 | Exceptional 9.9% |
| Immigrants | Zimbabwe | 98.7 /100 | #75 | Exceptional 9.9% |
| Immigrants | Croatia | 98.7 /100 | #76 | Exceptional 10.0% |
| Immigrants | North Macedonia | 98.7 /100 | #77 | Exceptional 10.0% |
| South Africans | 98.7 /100 | #78 | Exceptional 10.0% |
| Laotians | 98.7 /100 | #79 | Exceptional 10.0% |