Taiwanese vs Fijian Female Unemployment
COMPARE
Taiwanese
Fijian
Female Unemployment
Female Unemployment Comparison
Taiwanese
Fijians
5.3%
FEMALE UNEMPLOYMENT
42.7/ 100
METRIC RATING
181st/ 347
METRIC RANK
4.7%
FEMALE UNEMPLOYMENT
99.9/ 100
METRIC RATING
21st/ 347
METRIC RANK
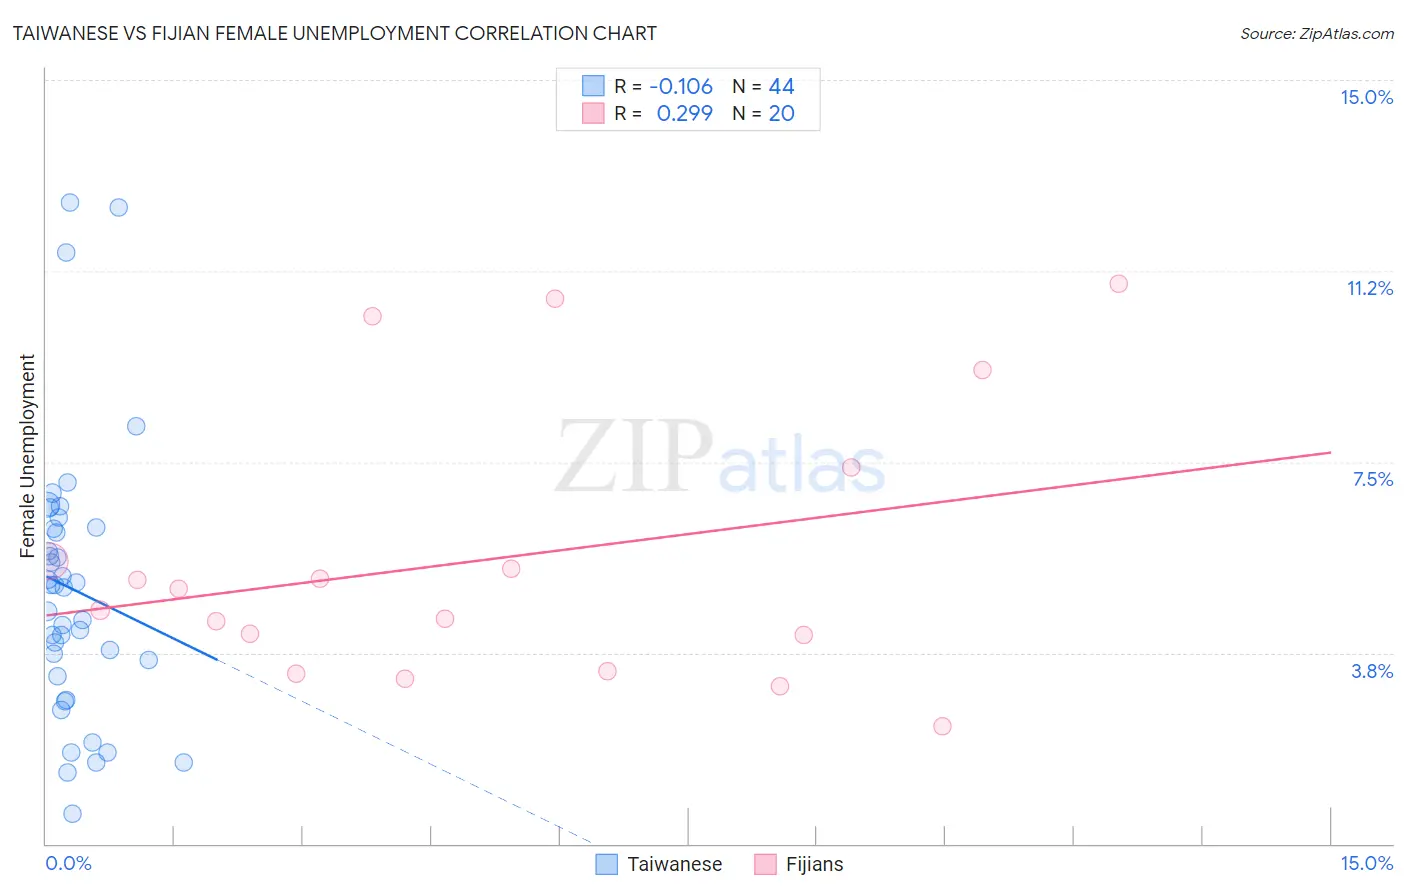
Taiwanese vs Fijian Female Unemployment Correlation Chart
The statistical analysis conducted on geographies consisting of 31,724,268 people shows a poor negative correlation between the proportion of Taiwanese and unemploymnet rate among females in the United States with a correlation coefficient (R) of -0.106 and weighted average of 5.3%. Similarly, the statistical analysis conducted on geographies consisting of 55,900,022 people shows a weak positive correlation between the proportion of Fijians and unemploymnet rate among females in the United States with a correlation coefficient (R) of 0.299 and weighted average of 4.7%, a difference of 12.7%.
Female Unemployment Correlation Summary
| Measurement | Taiwanese | Fijian |
| Minimum | 0.60% | 2.3% |
| Maximum | 12.6% | 11.0% |
| Range | 12.0% | 8.7% |
| Mean | 5.0% | 5.6% |
| Median | 5.0% | 4.8% |
| Interquartile 25% (IQ1) | 3.4% | 3.7% |
| Interquartile 75% (IQ3) | 6.2% | 6.5% |
| Interquartile Range (IQR) | 2.8% | 2.7% |
| Standard Deviation (Sample) | 2.7% | 2.7% |
| Standard Deviation (Population) | 2.6% | 2.6% |
Similar Demographics by Female Unemployment
Demographics Similar to Taiwanese by Female Unemployment
In terms of female unemployment, the demographic groups most similar to Taiwanese are Nonimmigrants (5.3%, a difference of 0.010%), Immigrants from Congo (5.3%, a difference of 0.020%), Immigrants from Indonesia (5.3%, a difference of 0.12%), Laotian (5.3%, a difference of 0.14%), and Immigrants from Ukraine (5.3%, a difference of 0.16%).
| Demographics | Rating | Rank | Female Unemployment |
| Immigrants | Poland | 50.0 /100 | #174 | Average 5.3% |
| Immigrants | Laos | 47.5 /100 | #175 | Average 5.3% |
| Immigrants | Vietnam | 47.5 /100 | #176 | Average 5.3% |
| Immigrants | Morocco | 47.4 /100 | #177 | Average 5.3% |
| Immigrants | Southern Europe | 46.2 /100 | #178 | Average 5.3% |
| Laotians | 45.1 /100 | #179 | Average 5.3% |
| Immigrants | Congo | 43.1 /100 | #180 | Average 5.3% |
| Taiwanese | 42.7 /100 | #181 | Average 5.3% |
| Immigrants | Nonimmigrants | 42.6 /100 | #182 | Average 5.3% |
| Immigrants | Indonesia | 40.7 /100 | #183 | Average 5.3% |
| Immigrants | Ukraine | 40.1 /100 | #184 | Average 5.3% |
| Malaysians | 40.1 /100 | #185 | Average 5.3% |
| Immigrants | Belarus | 39.4 /100 | #186 | Fair 5.3% |
| Immigrants | Albania | 35.4 /100 | #187 | Fair 5.3% |
| Afghans | 33.9 /100 | #188 | Fair 5.3% |
Demographics Similar to Fijians by Female Unemployment
In terms of female unemployment, the demographic groups most similar to Fijians are Bulgarian (4.7%, a difference of 0.010%), European (4.7%, a difference of 0.020%), Polish (4.7%, a difference of 0.090%), Latvian (4.7%, a difference of 0.10%), and Croatian (4.7%, a difference of 0.25%).
| Demographics | Rating | Rank | Female Unemployment |
| Finns | 100.0 /100 | #14 | Exceptional 4.6% |
| English | 100.0 /100 | #15 | Exceptional 4.6% |
| Carpatho Rusyns | 99.9 /100 | #16 | Exceptional 4.7% |
| Croatians | 99.9 /100 | #17 | Exceptional 4.7% |
| Latvians | 99.9 /100 | #18 | Exceptional 4.7% |
| Poles | 99.9 /100 | #19 | Exceptional 4.7% |
| Bulgarians | 99.9 /100 | #20 | Exceptional 4.7% |
| Fijians | 99.9 /100 | #21 | Exceptional 4.7% |
| Europeans | 99.9 /100 | #22 | Exceptional 4.7% |
| Scottish | 99.9 /100 | #23 | Exceptional 4.7% |
| Welsh | 99.9 /100 | #24 | Exceptional 4.7% |
| Immigrants | India | 99.9 /100 | #25 | Exceptional 4.7% |
| Immigrants | Bosnia and Herzegovina | 99.9 /100 | #26 | Exceptional 4.7% |
| British | 99.9 /100 | #27 | Exceptional 4.7% |
| Irish | 99.9 /100 | #28 | Exceptional 4.7% |