Taiwanese vs Afghan Receiving Food Stamps
COMPARE
Taiwanese
Afghan
Receiving Food Stamps
Receiving Food Stamps Comparison
Taiwanese
Afghans
11.0%
RECEIVING FOOD STAMPS
84.2/ 100
METRIC RATING
146th/ 347
METRIC RANK
10.7%
RECEIVING FOOD STAMPS
92.6/ 100
METRIC RATING
126th/ 347
METRIC RANK
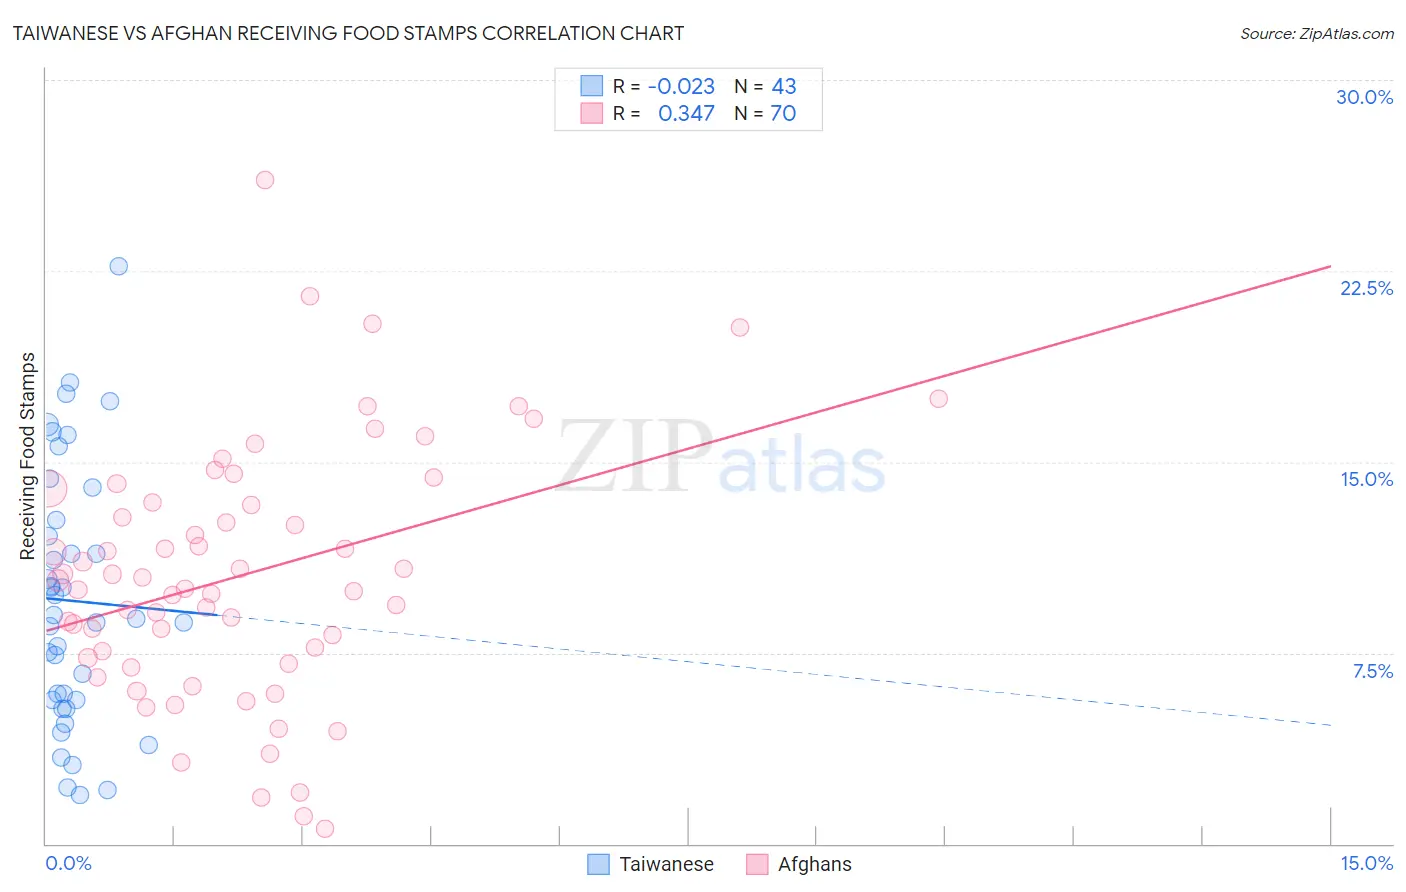
Taiwanese vs Afghan Receiving Food Stamps Correlation Chart
The statistical analysis conducted on geographies consisting of 31,675,875 people shows no correlation between the proportion of Taiwanese and percentage of population receiving government assistance and/or food stamps in the United States with a correlation coefficient (R) of -0.023 and weighted average of 11.0%. Similarly, the statistical analysis conducted on geographies consisting of 148,722,422 people shows a mild positive correlation between the proportion of Afghans and percentage of population receiving government assistance and/or food stamps in the United States with a correlation coefficient (R) of 0.347 and weighted average of 10.7%, a difference of 3.3%.
Receiving Food Stamps Correlation Summary
| Measurement | Taiwanese | Afghan |
| Minimum | 1.9% | 0.60% |
| Maximum | 22.7% | 26.1% |
| Range | 20.8% | 25.5% |
| Mean | 9.5% | 10.5% |
| Median | 8.8% | 10.2% |
| Interquartile 25% (IQ1) | 5.6% | 7.3% |
| Interquartile 75% (IQ3) | 12.7% | 13.4% |
| Interquartile Range (IQR) | 7.1% | 6.1% |
| Standard Deviation (Sample) | 5.0% | 5.0% |
| Standard Deviation (Population) | 5.0% | 4.9% |
Demographics Similar to Taiwanese and Afghans by Receiving Food Stamps
In terms of receiving food stamps, the demographic groups most similar to Taiwanese are Hungarian (11.0%, a difference of 0.24%), Syrian (11.0%, a difference of 0.36%), Immigrants from Northern Africa (11.0%, a difference of 0.51%), Chilean (11.0%, a difference of 0.59%), and Immigrants from Vietnam (11.0%, a difference of 0.76%). Similarly, the demographic groups most similar to Afghans are Immigrants from Ethiopia (10.7%, a difference of 0.020%), Immigrants from Jordan (10.7%, a difference of 0.030%), Yugoslavian (10.7%, a difference of 0.030%), Israeli (10.7%, a difference of 0.13%), and French (10.7%, a difference of 0.14%).
| Demographics | Rating | Rank | Receiving Food Stamps |
| Afghans | 92.6 /100 | #126 | Exceptional 10.7% |
| Immigrants | Ethiopia | 92.6 /100 | #127 | Exceptional 10.7% |
| Immigrants | Jordan | 92.5 /100 | #128 | Exceptional 10.7% |
| Yugoslavians | 92.5 /100 | #129 | Exceptional 10.7% |
| Israelis | 92.4 /100 | #130 | Exceptional 10.7% |
| French | 92.3 /100 | #131 | Exceptional 10.7% |
| Immigrants | Germany | 92.0 /100 | #132 | Exceptional 10.7% |
| Immigrants | Russia | 90.9 /100 | #133 | Exceptional 10.8% |
| Immigrants | Brazil | 90.3 /100 | #134 | Exceptional 10.8% |
| Argentineans | 90.2 /100 | #135 | Exceptional 10.8% |
| Slovaks | 89.8 /100 | #136 | Excellent 10.8% |
| Immigrants | Eastern Europe | 89.8 /100 | #137 | Excellent 10.8% |
| Immigrants | Moldova | 88.5 /100 | #138 | Excellent 10.9% |
| Hmong | 88.4 /100 | #139 | Excellent 10.9% |
| Celtics | 87.8 /100 | #140 | Excellent 10.9% |
| Immigrants | Vietnam | 86.7 /100 | #141 | Excellent 11.0% |
| Chileans | 86.2 /100 | #142 | Excellent 11.0% |
| Immigrants | Northern Africa | 86.0 /100 | #143 | Excellent 11.0% |
| Syrians | 85.5 /100 | #144 | Excellent 11.0% |
| Hungarians | 85.1 /100 | #145 | Excellent 11.0% |
| Taiwanese | 84.2 /100 | #146 | Excellent 11.0% |