Immigrants from Norway vs Immigrants from Poland Family Poverty
COMPARE
Immigrants from Norway
Immigrants from Poland
Family Poverty
Family Poverty Comparison
Immigrants from Norway
Immigrants from Poland
8.1%
FAMILY POVERTY
95.7/ 100
METRIC RATING
101st/ 347
METRIC RANK
7.9%
FAMILY POVERTY
97.8/ 100
METRIC RATING
82nd/ 347
METRIC RANK
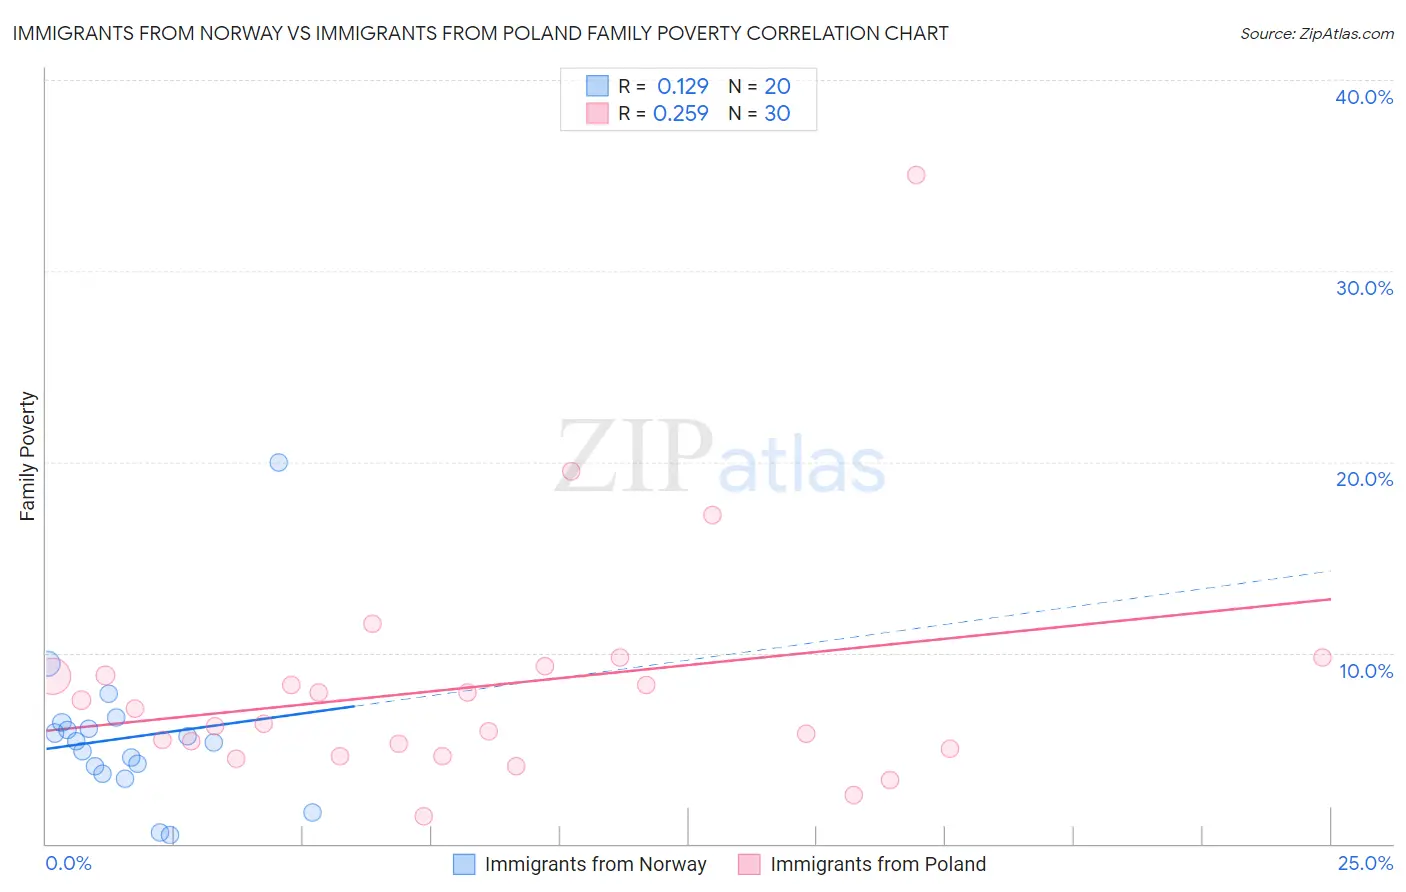
Immigrants from Norway vs Immigrants from Poland Family Poverty Correlation Chart
The statistical analysis conducted on geographies consisting of 116,627,868 people shows a poor positive correlation between the proportion of Immigrants from Norway and poverty level among families in the United States with a correlation coefficient (R) of 0.129 and weighted average of 8.1%. Similarly, the statistical analysis conducted on geographies consisting of 304,048,718 people shows a weak positive correlation between the proportion of Immigrants from Poland and poverty level among families in the United States with a correlation coefficient (R) of 0.259 and weighted average of 7.9%, a difference of 2.5%.
Family Poverty Correlation Summary
| Measurement | Immigrants from Norway | Immigrants from Poland |
| Minimum | 0.43% | 1.5% |
| Maximum | 20.0% | 35.0% |
| Range | 19.6% | 33.5% |
| Mean | 5.6% | 8.2% |
| Median | 5.3% | 6.7% |
| Interquartile 25% (IQ1) | 3.9% | 5.0% |
| Interquartile 75% (IQ3) | 6.2% | 8.8% |
| Interquartile Range (IQR) | 2.3% | 3.8% |
| Standard Deviation (Sample) | 4.0% | 6.3% |
| Standard Deviation (Population) | 3.9% | 6.2% |
Demographics Similar to Immigrants from Norway and Immigrants from Poland by Family Poverty
In terms of family poverty, the demographic groups most similar to Immigrants from Norway are New Zealander (8.1%, a difference of 0.030%), Welsh (8.1%, a difference of 0.10%), Immigrants from South Africa (8.1%, a difference of 0.17%), Immigrants from Switzerland (8.1%, a difference of 0.38%), and Immigrants from Turkey (8.0%, a difference of 0.79%). Similarly, the demographic groups most similar to Immigrants from Poland are Irish (7.9%, a difference of 0.030%), Slovak (7.9%, a difference of 0.18%), British (7.9%, a difference of 0.42%), Immigrants from Asia (7.9%, a difference of 0.67%), and Scottish (7.9%, a difference of 0.71%).
| Demographics | Rating | Rank | Family Poverty |
| Irish | 97.8 /100 | #81 | Exceptional 7.9% |
| Immigrants | Poland | 97.8 /100 | #82 | Exceptional 7.9% |
| Slovaks | 97.7 /100 | #83 | Exceptional 7.9% |
| British | 97.5 /100 | #84 | Exceptional 7.9% |
| Immigrants | Asia | 97.4 /100 | #85 | Exceptional 7.9% |
| Scottish | 97.3 /100 | #86 | Exceptional 7.9% |
| Belgians | 97.3 /100 | #87 | Exceptional 8.0% |
| Serbians | 97.2 /100 | #88 | Exceptional 8.0% |
| Immigrants | Denmark | 97.1 /100 | #89 | Exceptional 8.0% |
| Immigrants | England | 97.1 /100 | #90 | Exceptional 8.0% |
| Immigrants | Italy | 97.0 /100 | #91 | Exceptional 8.0% |
| Czechoslovakians | 96.8 /100 | #92 | Exceptional 8.0% |
| Tlingit-Haida | 96.7 /100 | #93 | Exceptional 8.0% |
| Immigrants | Pakistan | 96.6 /100 | #94 | Exceptional 8.0% |
| Immigrants | Philippines | 96.5 /100 | #95 | Exceptional 8.0% |
| Immigrants | Turkey | 96.5 /100 | #96 | Exceptional 8.0% |
| Immigrants | Switzerland | 96.1 /100 | #97 | Exceptional 8.1% |
| Immigrants | South Africa | 95.9 /100 | #98 | Exceptional 8.1% |
| Welsh | 95.8 /100 | #99 | Exceptional 8.1% |
| New Zealanders | 95.8 /100 | #100 | Exceptional 8.1% |
| Immigrants | Norway | 95.7 /100 | #101 | Exceptional 8.1% |