Syrian vs Immigrants from Barbados Family Poverty
COMPARE
Syrian
Immigrants from Barbados
Family Poverty
Family Poverty Comparison
Syrians
Immigrants from Barbados
8.6%
FAMILY POVERTY
80.3/ 100
METRIC RATING
150th/ 347
METRIC RANK
11.5%
FAMILY POVERTY
0.0/ 100
METRIC RATING
289th/ 347
METRIC RANK
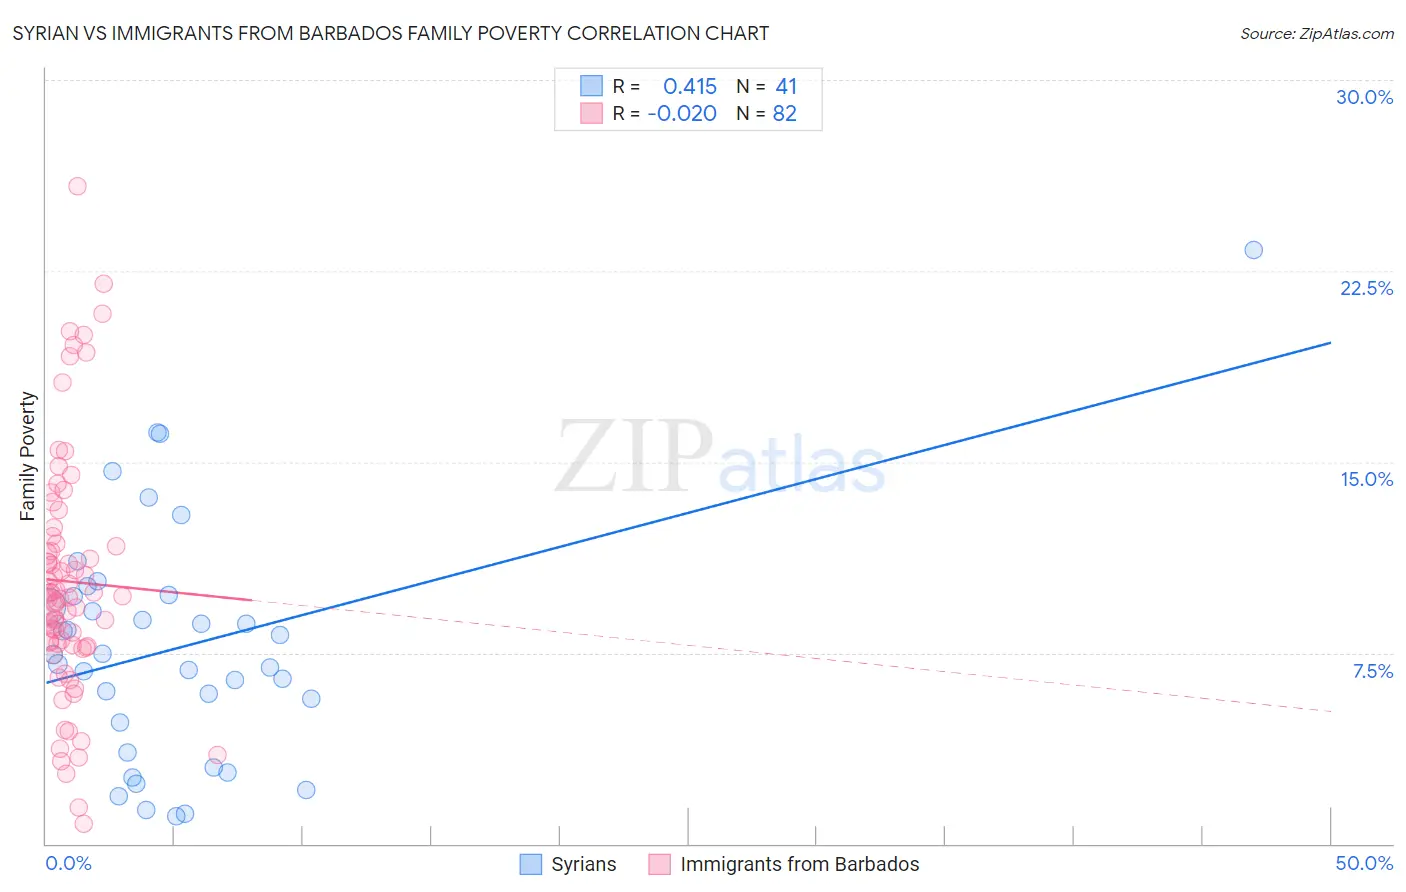
Syrian vs Immigrants from Barbados Family Poverty Correlation Chart
The statistical analysis conducted on geographies consisting of 265,791,569 people shows a moderate positive correlation between the proportion of Syrians and poverty level among families in the United States with a correlation coefficient (R) of 0.415 and weighted average of 8.6%. Similarly, the statistical analysis conducted on geographies consisting of 112,741,244 people shows no correlation between the proportion of Immigrants from Barbados and poverty level among families in the United States with a correlation coefficient (R) of -0.020 and weighted average of 11.5%, a difference of 34.1%.
Family Poverty Correlation Summary
| Measurement | Syrian | Immigrants from Barbados |
| Minimum | 1.1% | 0.78% |
| Maximum | 23.3% | 25.8% |
| Range | 22.3% | 25.0% |
| Mean | 7.7% | 10.3% |
| Median | 7.4% | 9.7% |
| Interquartile 25% (IQ1) | 4.2% | 7.8% |
| Interquartile 75% (IQ3) | 9.7% | 11.8% |
| Interquartile Range (IQR) | 5.6% | 4.0% |
| Standard Deviation (Sample) | 4.7% | 4.8% |
| Standard Deviation (Population) | 4.6% | 4.8% |
Similar Demographics by Family Poverty
Demographics Similar to Syrians by Family Poverty
In terms of family poverty, the demographic groups most similar to Syrians are Mongolian (8.6%, a difference of 0.0%), Brazilian (8.6%, a difference of 0.050%), Samoan (8.6%, a difference of 0.13%), Immigrants from Spain (8.6%, a difference of 0.26%), and Scotch-Irish (8.6%, a difference of 0.41%).
| Demographics | Rating | Rank | Family Poverty |
| Immigrants | Germany | 83.3 /100 | #143 | Excellent 8.5% |
| Albanians | 83.3 /100 | #144 | Excellent 8.5% |
| Immigrants | South Eastern Asia | 83.2 /100 | #145 | Excellent 8.5% |
| Immigrants | Belarus | 83.2 /100 | #146 | Excellent 8.5% |
| Immigrants | Jordan | 83.0 /100 | #147 | Excellent 8.5% |
| Scotch-Irish | 82.2 /100 | #148 | Excellent 8.6% |
| Mongolians | 80.4 /100 | #149 | Excellent 8.6% |
| Syrians | 80.3 /100 | #150 | Excellent 8.6% |
| Brazilians | 80.1 /100 | #151 | Excellent 8.6% |
| Samoans | 79.8 /100 | #152 | Good 8.6% |
| Immigrants | Spain | 79.1 /100 | #153 | Good 8.6% |
| Immigrants | Vietnam | 75.4 /100 | #154 | Good 8.7% |
| Immigrants | Kuwait | 73.6 /100 | #155 | Good 8.7% |
| Immigrants | Oceania | 71.2 /100 | #156 | Good 8.7% |
| Tsimshian | 69.3 /100 | #157 | Good 8.8% |
Demographics Similar to Immigrants from Barbados by Family Poverty
In terms of family poverty, the demographic groups most similar to Immigrants from Barbados are West Indian (11.5%, a difference of 0.010%), Immigrants from Belize (11.5%, a difference of 0.050%), Haitian (11.5%, a difference of 0.070%), Immigrants from Somalia (11.5%, a difference of 0.18%), and Vietnamese (11.5%, a difference of 0.24%).
| Demographics | Rating | Rank | Family Poverty |
| Immigrants | Cuba | 0.0 /100 | #282 | Tragic 11.3% |
| Indonesians | 0.0 /100 | #283 | Tragic 11.3% |
| Yaqui | 0.0 /100 | #284 | Tragic 11.3% |
| Barbadians | 0.0 /100 | #285 | Tragic 11.3% |
| Senegalese | 0.0 /100 | #286 | Tragic 11.5% |
| Vietnamese | 0.0 /100 | #287 | Tragic 11.5% |
| Immigrants | Belize | 0.0 /100 | #288 | Tragic 11.5% |
| Immigrants | Barbados | 0.0 /100 | #289 | Tragic 11.5% |
| West Indians | 0.0 /100 | #290 | Tragic 11.5% |
| Haitians | 0.0 /100 | #291 | Tragic 11.5% |
| Immigrants | Somalia | 0.0 /100 | #292 | Tragic 11.5% |
| Immigrants | Cabo Verde | 0.0 /100 | #293 | Tragic 11.6% |
| Immigrants | St. Vincent and the Grenadines | 0.0 /100 | #294 | Tragic 11.6% |
| Immigrants | Haiti | 0.0 /100 | #295 | Tragic 11.6% |
| Choctaw | 0.0 /100 | #296 | Tragic 11.6% |