Dominican vs Lumbee Single Male Poverty
COMPARE
Dominican
Lumbee
Single Male Poverty
Single Male Poverty Comparison
Dominicans
Lumbee
15.2%
SINGLE MALE POVERTY
0.0/ 100
METRIC RATING
301st/ 347
METRIC RANK
25.2%
SINGLE MALE POVERTY
0.0/ 100
METRIC RATING
344th/ 347
METRIC RANK
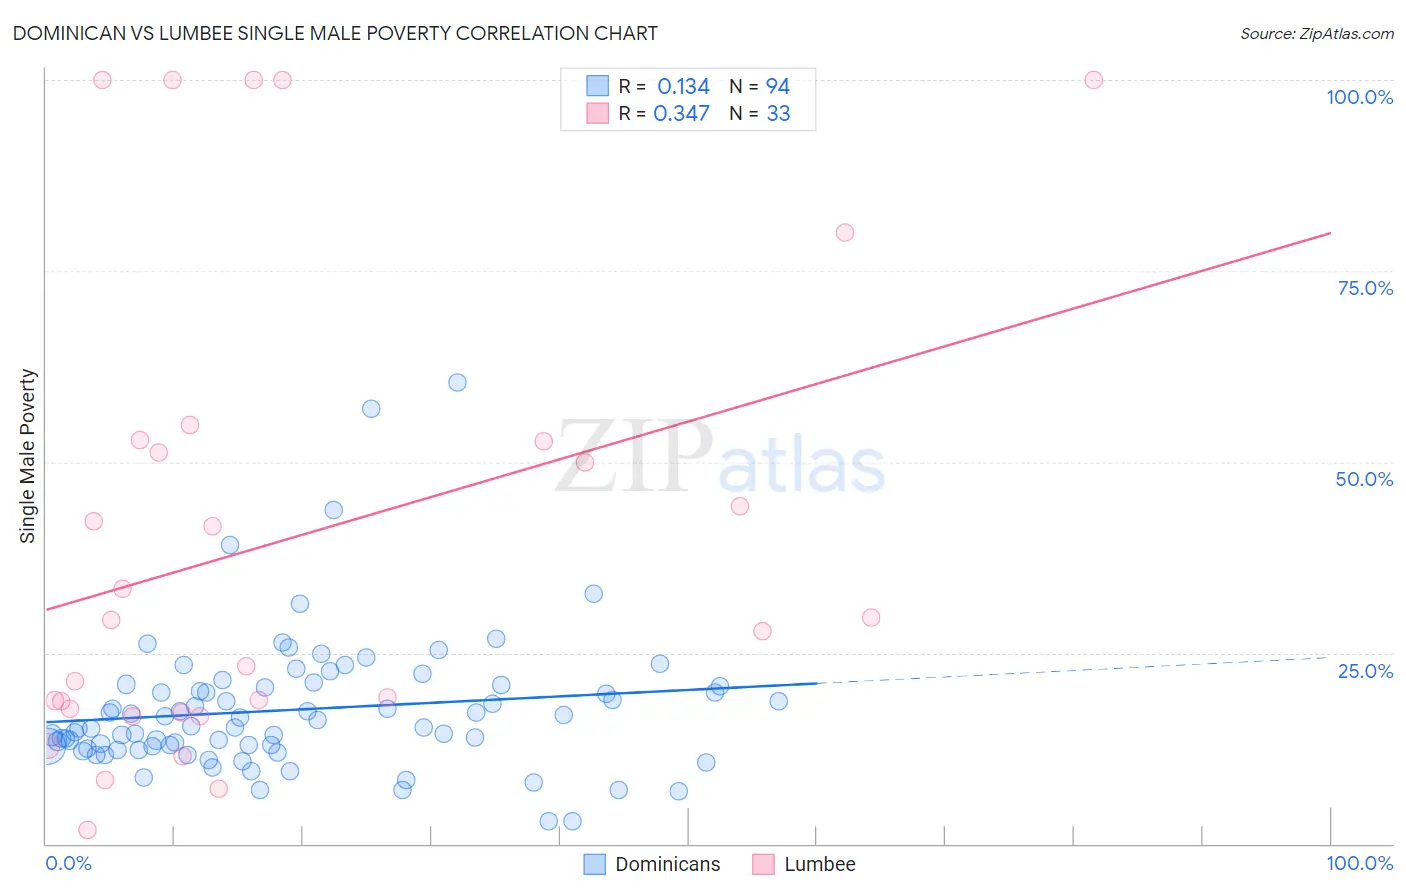
Dominican vs Lumbee Single Male Poverty Correlation Chart
The statistical analysis conducted on geographies consisting of 318,233,165 people shows a poor positive correlation between the proportion of Dominicans and poverty level among single males in the United States with a correlation coefficient (R) of 0.134 and weighted average of 15.2%. Similarly, the statistical analysis conducted on geographies consisting of 87,687,707 people shows a mild positive correlation between the proportion of Lumbee and poverty level among single males in the United States with a correlation coefficient (R) of 0.347 and weighted average of 25.2%, a difference of 65.3%.
Single Male Poverty Correlation Summary
| Measurement | Dominican | Lumbee |
| Minimum | 2.9% | 1.9% |
| Maximum | 60.5% | 100.0% |
| Range | 57.6% | 98.1% |
| Mean | 17.6% | 40.0% |
| Median | 15.4% | 29.4% |
| Interquartile 25% (IQ1) | 12.8% | 17.5% |
| Interquartile 75% (IQ3) | 20.6% | 52.8% |
| Interquartile Range (IQR) | 7.8% | 35.4% |
| Standard Deviation (Sample) | 9.1% | 30.8% |
| Standard Deviation (Population) | 9.1% | 30.4% |
Similar Demographics by Single Male Poverty
Demographics Similar to Dominicans by Single Male Poverty
In terms of single male poverty, the demographic groups most similar to Dominicans are Alsatian (15.2%, a difference of 0.16%), Cree (15.1%, a difference of 0.82%), Aleut (15.4%, a difference of 1.2%), Delaware (15.0%, a difference of 1.3%), and Alaska Native (15.4%, a difference of 1.3%).
| Demographics | Rating | Rank | Single Male Poverty |
| Ottawa | 0.0 /100 | #294 | Tragic 14.6% |
| Scotch-Irish | 0.0 /100 | #295 | Tragic 14.7% |
| Africans | 0.0 /100 | #296 | Tragic 14.7% |
| Immigrants | Dominican Republic | 0.0 /100 | #297 | Tragic 14.8% |
| French American Indians | 0.0 /100 | #298 | Tragic 15.0% |
| Delaware | 0.0 /100 | #299 | Tragic 15.0% |
| Cree | 0.0 /100 | #300 | Tragic 15.1% |
| Dominicans | 0.0 /100 | #301 | Tragic 15.2% |
| Alsatians | 0.0 /100 | #302 | Tragic 15.2% |
| Aleuts | 0.0 /100 | #303 | Tragic 15.4% |
| Alaska Natives | 0.0 /100 | #304 | Tragic 15.4% |
| Blackfeet | 0.0 /100 | #305 | Tragic 15.5% |
| Pennsylvania Germans | 0.0 /100 | #306 | Tragic 15.6% |
| Ute | 0.0 /100 | #307 | Tragic 15.7% |
| Potawatomi | 0.0 /100 | #308 | Tragic 15.8% |
Demographics Similar to Lumbee by Single Male Poverty
In terms of single male poverty, the demographic groups most similar to Lumbee are Puerto Rican (25.1%, a difference of 0.31%), Navajo (25.3%, a difference of 0.73%), Houma (23.5%, a difference of 7.3%), Crow (23.3%, a difference of 8.1%), and Hopi (27.5%, a difference of 9.3%).
| Demographics | Rating | Rank | Single Male Poverty |
| Inupiat | 0.0 /100 | #333 | Tragic 20.0% |
| Pima | 0.0 /100 | #334 | Tragic 20.2% |
| Yuman | 0.0 /100 | #335 | Tragic 21.3% |
| Tohono O'odham | 0.0 /100 | #336 | Tragic 21.6% |
| Apache | 0.0 /100 | #337 | Tragic 21.6% |
| Pueblo | 0.0 /100 | #338 | Tragic 21.6% |
| Arapaho | 0.0 /100 | #339 | Tragic 21.9% |
| Sioux | 0.0 /100 | #340 | Tragic 22.2% |
| Crow | 0.0 /100 | #341 | Tragic 23.3% |
| Houma | 0.0 /100 | #342 | Tragic 23.5% |
| Puerto Ricans | 0.0 /100 | #343 | Tragic 25.1% |
| Lumbee | 0.0 /100 | #344 | Tragic 25.2% |
| Navajo | 0.0 /100 | #345 | Tragic 25.3% |
| Hopi | 0.0 /100 | #346 | Tragic 27.5% |
| Yup'ik | 0.0 /100 | #347 | Tragic 31.6% |