Immigrants from Bangladesh vs Lumbee Single Male Poverty
COMPARE
Immigrants from Bangladesh
Lumbee
Single Male Poverty
Single Male Poverty Comparison
Immigrants from Bangladesh
Lumbee
13.0%
SINGLE MALE POVERTY
20.4/ 100
METRIC RATING
203rd/ 347
METRIC RANK
25.2%
SINGLE MALE POVERTY
0.0/ 100
METRIC RATING
344th/ 347
METRIC RANK
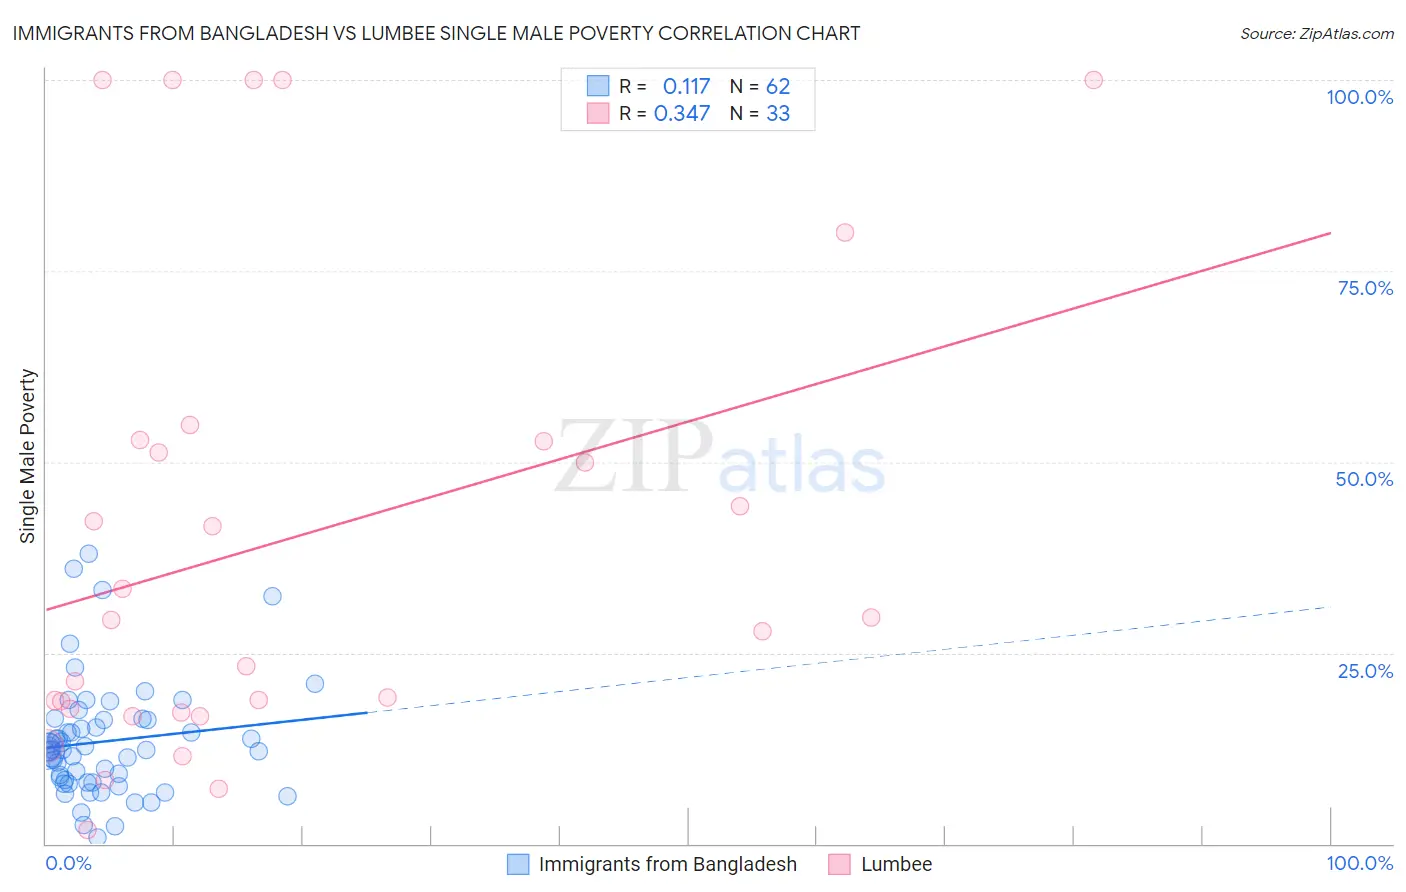
Immigrants from Bangladesh vs Lumbee Single Male Poverty Correlation Chart
The statistical analysis conducted on geographies consisting of 188,106,826 people shows a poor positive correlation between the proportion of Immigrants from Bangladesh and poverty level among single males in the United States with a correlation coefficient (R) of 0.117 and weighted average of 13.0%. Similarly, the statistical analysis conducted on geographies consisting of 87,687,707 people shows a mild positive correlation between the proportion of Lumbee and poverty level among single males in the United States with a correlation coefficient (R) of 0.347 and weighted average of 25.2%, a difference of 93.1%.
Single Male Poverty Correlation Summary
| Measurement | Immigrants from Bangladesh | Lumbee |
| Minimum | 0.77% | 1.9% |
| Maximum | 38.0% | 100.0% |
| Range | 37.2% | 98.1% |
| Mean | 13.4% | 40.0% |
| Median | 12.2% | 29.4% |
| Interquartile 25% (IQ1) | 8.1% | 17.5% |
| Interquartile 75% (IQ3) | 16.3% | 52.8% |
| Interquartile Range (IQR) | 8.2% | 35.4% |
| Standard Deviation (Sample) | 7.6% | 30.8% |
| Standard Deviation (Population) | 7.6% | 30.4% |
Similar Demographics by Single Male Poverty
Demographics Similar to Immigrants from Bangladesh by Single Male Poverty
In terms of single male poverty, the demographic groups most similar to Immigrants from Bangladesh are Estonian (13.0%, a difference of 0.0%), Basque (13.0%, a difference of 0.030%), Trinidadian and Tobagonian (13.0%, a difference of 0.090%), Polish (13.0%, a difference of 0.090%), and Slovene (13.0%, a difference of 0.10%).
| Demographics | Rating | Rank | Single Male Poverty |
| Immigrants | Grenada | 23.1 /100 | #196 | Fair 13.0% |
| Immigrants | Laos | 23.1 /100 | #197 | Fair 13.0% |
| Lithuanians | 22.1 /100 | #198 | Fair 13.0% |
| Immigrants | Norway | 21.8 /100 | #199 | Fair 13.0% |
| Slovenes | 21.6 /100 | #200 | Fair 13.0% |
| Trinidadians and Tobagonians | 21.4 /100 | #201 | Fair 13.0% |
| Basques | 20.7 /100 | #202 | Fair 13.0% |
| Immigrants | Bangladesh | 20.4 /100 | #203 | Fair 13.0% |
| Estonians | 20.3 /100 | #204 | Fair 13.0% |
| Poles | 19.3 /100 | #205 | Poor 13.0% |
| Northern Europeans | 18.9 /100 | #206 | Poor 13.0% |
| Sudanese | 17.7 /100 | #207 | Poor 13.1% |
| Immigrants | Western Africa | 17.6 /100 | #208 | Poor 13.1% |
| Mexican American Indians | 17.5 /100 | #209 | Poor 13.1% |
| Immigrants | Haiti | 16.8 /100 | #210 | Poor 13.1% |
Demographics Similar to Lumbee by Single Male Poverty
In terms of single male poverty, the demographic groups most similar to Lumbee are Puerto Rican (25.1%, a difference of 0.31%), Navajo (25.3%, a difference of 0.73%), Houma (23.5%, a difference of 7.3%), Crow (23.3%, a difference of 8.1%), and Hopi (27.5%, a difference of 9.3%).
| Demographics | Rating | Rank | Single Male Poverty |
| Inupiat | 0.0 /100 | #333 | Tragic 20.0% |
| Pima | 0.0 /100 | #334 | Tragic 20.2% |
| Yuman | 0.0 /100 | #335 | Tragic 21.3% |
| Tohono O'odham | 0.0 /100 | #336 | Tragic 21.6% |
| Apache | 0.0 /100 | #337 | Tragic 21.6% |
| Pueblo | 0.0 /100 | #338 | Tragic 21.6% |
| Arapaho | 0.0 /100 | #339 | Tragic 21.9% |
| Sioux | 0.0 /100 | #340 | Tragic 22.2% |
| Crow | 0.0 /100 | #341 | Tragic 23.3% |
| Houma | 0.0 /100 | #342 | Tragic 23.5% |
| Puerto Ricans | 0.0 /100 | #343 | Tragic 25.1% |
| Lumbee | 0.0 /100 | #344 | Tragic 25.2% |
| Navajo | 0.0 /100 | #345 | Tragic 25.3% |
| Hopi | 0.0 /100 | #346 | Tragic 27.5% |
| Yup'ik | 0.0 /100 | #347 | Tragic 31.6% |