Immigrants from Switzerland vs Immigrants from Middle Africa Single Father Poverty
COMPARE
Immigrants from Switzerland
Immigrants from Middle Africa
Single Father Poverty
Single Father Poverty Comparison
Immigrants from Switzerland
Immigrants from Middle Africa
16.5%
SINGLE FATHER POVERTY
24.8/ 100
METRIC RATING
192nd/ 347
METRIC RANK
15.6%
SINGLE FATHER POVERTY
97.4/ 100
METRIC RATING
99th/ 347
METRIC RANK
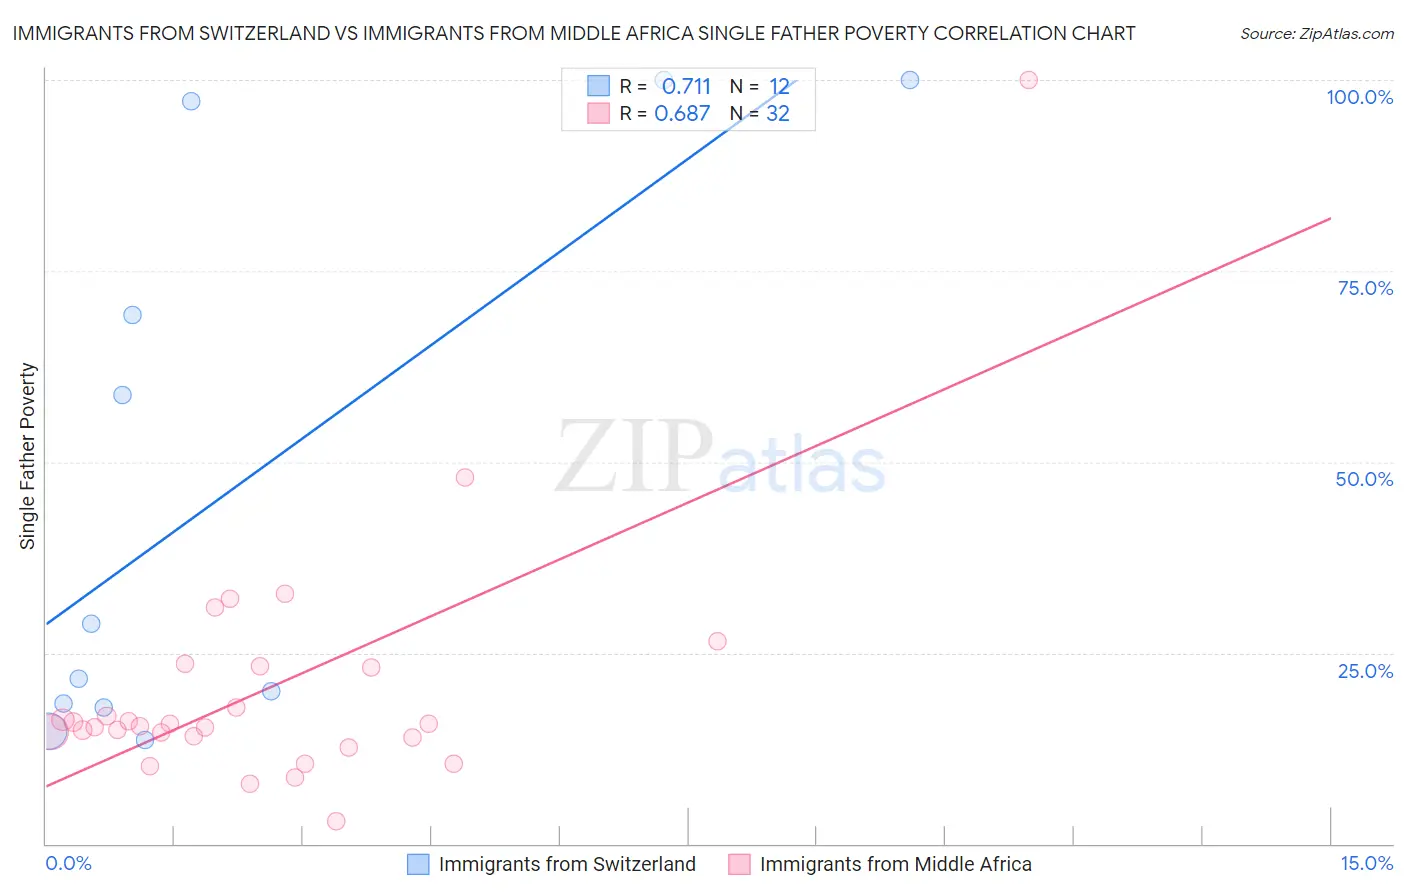
Immigrants from Switzerland vs Immigrants from Middle Africa Single Father Poverty Correlation Chart
The statistical analysis conducted on geographies consisting of 124,581,780 people shows a strong positive correlation between the proportion of Immigrants from Switzerland and poverty level among single fathers in the United States with a correlation coefficient (R) of 0.711 and weighted average of 16.5%. Similarly, the statistical analysis conducted on geographies consisting of 176,911,410 people shows a significant positive correlation between the proportion of Immigrants from Middle Africa and poverty level among single fathers in the United States with a correlation coefficient (R) of 0.687 and weighted average of 15.6%, a difference of 5.5%.
Single Father Poverty Correlation Summary
| Measurement | Immigrants from Switzerland | Immigrants from Middle Africa |
| Minimum | 13.7% | 3.0% |
| Maximum | 100.0% | 100.0% |
| Range | 86.3% | 97.0% |
| Mean | 46.7% | 20.3% |
| Median | 25.2% | 15.6% |
| Interquartile 25% (IQ1) | 18.1% | 14.0% |
| Interquartile 75% (IQ3) | 83.2% | 23.2% |
| Interquartile Range (IQR) | 65.1% | 9.2% |
| Standard Deviation (Sample) | 36.1% | 17.0% |
| Standard Deviation (Population) | 34.5% | 16.7% |
Similar Demographics by Single Father Poverty
Demographics Similar to Immigrants from Switzerland by Single Father Poverty
In terms of single father poverty, the demographic groups most similar to Immigrants from Switzerland are Ecuadorian (16.5%, a difference of 0.010%), Cape Verdean (16.5%, a difference of 0.020%), Immigrants from Barbados (16.5%, a difference of 0.030%), Immigrants from Guyana (16.5%, a difference of 0.13%), and Immigrants from Canada (16.5%, a difference of 0.17%).
| Demographics | Rating | Rank | Single Father Poverty |
| Panamanians | 33.6 /100 | #185 | Fair 16.4% |
| Immigrants | Venezuela | 31.0 /100 | #186 | Fair 16.4% |
| Ukrainians | 30.4 /100 | #187 | Fair 16.4% |
| Russians | 30.1 /100 | #188 | Fair 16.4% |
| Latvians | 28.9 /100 | #189 | Fair 16.5% |
| Immigrants | Burma/Myanmar | 28.0 /100 | #190 | Fair 16.5% |
| Immigrants | Guyana | 27.1 /100 | #191 | Fair 16.5% |
| Immigrants | Switzerland | 24.8 /100 | #192 | Fair 16.5% |
| Ecuadorians | 24.5 /100 | #193 | Fair 16.5% |
| Cape Verdeans | 24.4 /100 | #194 | Fair 16.5% |
| Immigrants | Barbados | 24.3 /100 | #195 | Fair 16.5% |
| Immigrants | Canada | 21.9 /100 | #196 | Fair 16.5% |
| Immigrants | Northern Europe | 20.3 /100 | #197 | Fair 16.5% |
| Romanians | 20.1 /100 | #198 | Fair 16.5% |
| Immigrants | Belize | 19.8 /100 | #199 | Poor 16.5% |
Demographics Similar to Immigrants from Middle Africa by Single Father Poverty
In terms of single father poverty, the demographic groups most similar to Immigrants from Middle Africa are Immigrants from Chile (15.7%, a difference of 0.22%), Fijian (15.7%, a difference of 0.25%), Zimbabwean (15.6%, a difference of 0.36%), Yaqui (15.6%, a difference of 0.37%), and Immigrants from Belgium (15.6%, a difference of 0.38%).
| Demographics | Rating | Rank | Single Father Poverty |
| Immigrants | Serbia | 98.5 /100 | #92 | Exceptional 15.5% |
| Basques | 98.4 /100 | #93 | Exceptional 15.5% |
| Immigrants | Uruguay | 98.2 /100 | #94 | Exceptional 15.6% |
| Immigrants | Kazakhstan | 98.2 /100 | #95 | Exceptional 15.6% |
| Immigrants | Belgium | 98.1 /100 | #96 | Exceptional 15.6% |
| Yaqui | 98.1 /100 | #97 | Exceptional 15.6% |
| Zimbabweans | 98.1 /100 | #98 | Exceptional 15.6% |
| Immigrants | Middle Africa | 97.4 /100 | #99 | Exceptional 15.6% |
| Immigrants | Chile | 96.9 /100 | #100 | Exceptional 15.7% |
| Fijians | 96.8 /100 | #101 | Exceptional 15.7% |
| Chileans | 96.4 /100 | #102 | Exceptional 15.7% |
| South American Indians | 96.2 /100 | #103 | Exceptional 15.7% |
| Australians | 96.1 /100 | #104 | Exceptional 15.7% |
| Immigrants | Australia | 96.1 /100 | #105 | Exceptional 15.7% |
| Immigrants | Poland | 95.8 /100 | #106 | Exceptional 15.7% |