Sudanese vs Immigrants from Middle Africa College, 1 year or more
COMPARE
Sudanese
Immigrants from Middle Africa
College, 1 year or more
College, 1 year or more Comparison
Sudanese
Immigrants from Middle Africa
60.2%
COLLEGE, 1 YEAR OR MORE
73.0/ 100
METRIC RATING
154th/ 347
METRIC RANK
58.0%
COLLEGE, 1 YEAR OR MORE
14.0/ 100
METRIC RATING
209th/ 347
METRIC RANK
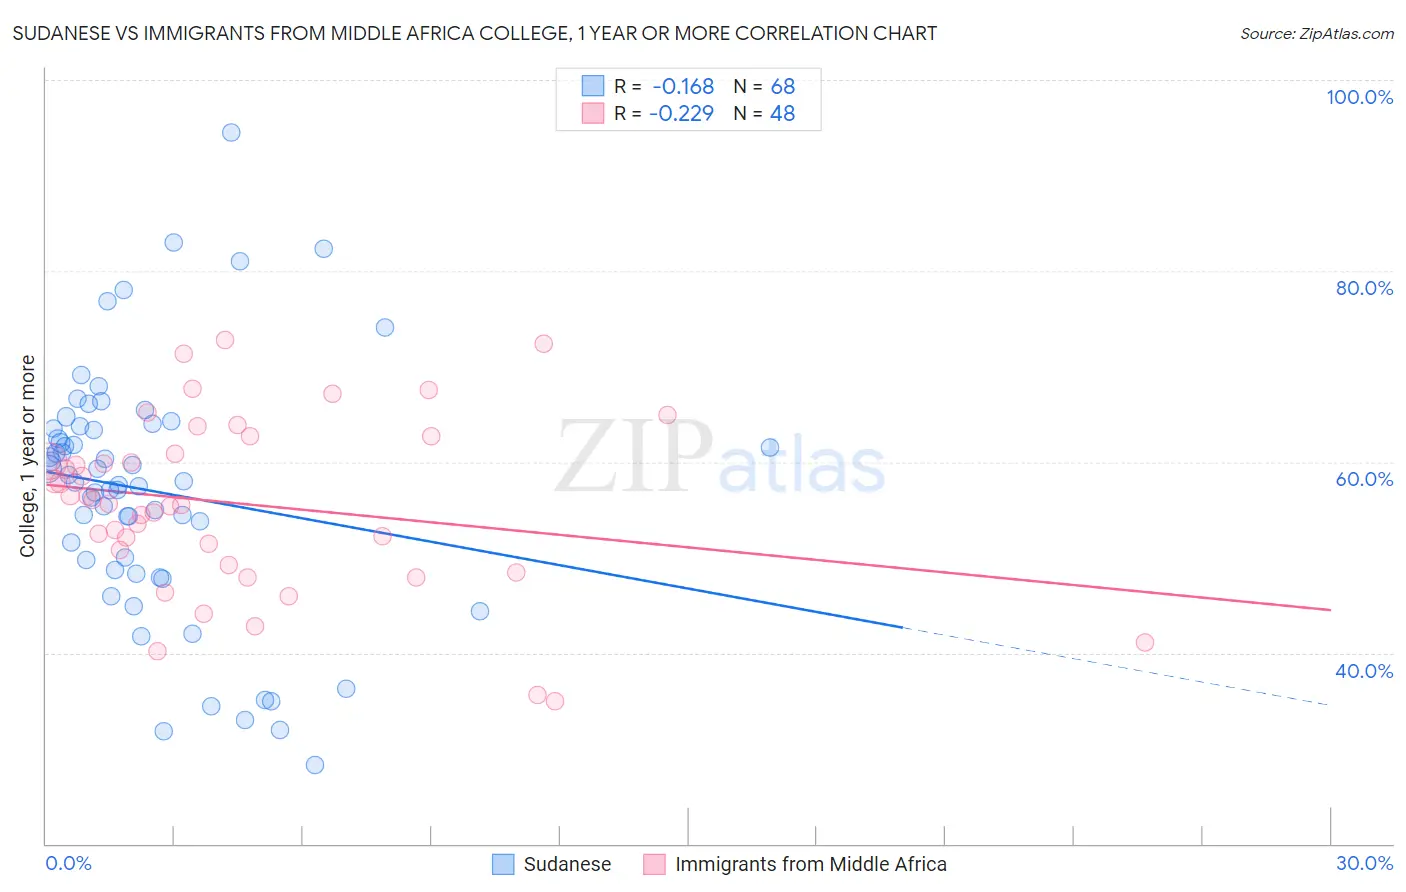
Sudanese vs Immigrants from Middle Africa College, 1 year or more Correlation Chart
The statistical analysis conducted on geographies consisting of 110,147,806 people shows a poor negative correlation between the proportion of Sudanese and percentage of population with at least college, 1 year or more education in the United States with a correlation coefficient (R) of -0.168 and weighted average of 60.2%. Similarly, the statistical analysis conducted on geographies consisting of 202,746,410 people shows a weak negative correlation between the proportion of Immigrants from Middle Africa and percentage of population with at least college, 1 year or more education in the United States with a correlation coefficient (R) of -0.229 and weighted average of 58.0%, a difference of 3.8%.
College, 1 year or more Correlation Summary
| Measurement | Sudanese | Immigrants from Middle Africa |
| Minimum | 28.3% | 35.0% |
| Maximum | 94.5% | 72.8% |
| Range | 66.2% | 37.9% |
| Mean | 56.9% | 55.6% |
| Median | 57.9% | 55.8% |
| Interquartile 25% (IQ1) | 49.2% | 50.0% |
| Interquartile 75% (IQ3) | 63.6% | 61.8% |
| Interquartile Range (IQR) | 14.4% | 11.8% |
| Standard Deviation (Sample) | 13.1% | 9.1% |
| Standard Deviation (Population) | 13.0% | 9.0% |
Similar Demographics by College, 1 year or more
Demographics Similar to Sudanese by College, 1 year or more
In terms of college, 1 year or more, the demographic groups most similar to Sudanese are Moroccan (60.2%, a difference of 0.0%), Finnish (60.2%, a difference of 0.0%), Sierra Leonean (60.2%, a difference of 0.080%), Immigrants from Germany (60.3%, a difference of 0.22%), and Immigrants from Armenia (60.0%, a difference of 0.26%).
| Demographics | Rating | Rank | College, 1 year or more |
| Immigrants | Kenya | 79.1 /100 | #147 | Good 60.5% |
| Kenyans | 79.0 /100 | #148 | Good 60.5% |
| Brazilians | 79.0 /100 | #149 | Good 60.5% |
| Immigrants | Sudan | 77.8 /100 | #150 | Good 60.4% |
| Albanians | 77.8 /100 | #151 | Good 60.4% |
| Immigrants | Germany | 76.1 /100 | #152 | Good 60.3% |
| Sierra Leoneans | 74.1 /100 | #153 | Good 60.2% |
| Sudanese | 73.0 /100 | #154 | Good 60.2% |
| Moroccans | 72.9 /100 | #155 | Good 60.2% |
| Finns | 72.9 /100 | #156 | Good 60.2% |
| Immigrants | Armenia | 68.8 /100 | #157 | Good 60.0% |
| English | 67.2 /100 | #158 | Good 60.0% |
| Immigrants | Iraq | 67.0 /100 | #159 | Good 60.0% |
| South American Indians | 66.9 /100 | #160 | Good 60.0% |
| Somalis | 64.5 /100 | #161 | Good 59.9% |
Demographics Similar to Immigrants from Middle Africa by College, 1 year or more
In terms of college, 1 year or more, the demographic groups most similar to Immigrants from Middle Africa are Tsimshian (57.9%, a difference of 0.060%), Immigrants from Nigeria (57.9%, a difference of 0.080%), Immigrants from Uruguay (58.1%, a difference of 0.13%), Immigrants from Senegal (57.8%, a difference of 0.26%), and French Canadian (57.8%, a difference of 0.26%).
| Demographics | Rating | Rank | College, 1 year or more |
| Immigrants | South America | 21.9 /100 | #202 | Fair 58.4% |
| Ghanaians | 20.9 /100 | #203 | Fair 58.4% |
| Panamanians | 19.2 /100 | #204 | Poor 58.3% |
| Immigrants | Zaire | 18.7 /100 | #205 | Poor 58.3% |
| Immigrants | Vietnam | 18.2 /100 | #206 | Poor 58.2% |
| Senegalese | 16.9 /100 | #207 | Poor 58.2% |
| Immigrants | Uruguay | 15.2 /100 | #208 | Poor 58.1% |
| Immigrants | Middle Africa | 14.0 /100 | #209 | Poor 58.0% |
| Tsimshian | 13.5 /100 | #210 | Poor 57.9% |
| Immigrants | Nigeria | 13.3 /100 | #211 | Poor 57.9% |
| Immigrants | Senegal | 11.8 /100 | #212 | Poor 57.8% |
| French Canadians | 11.8 /100 | #213 | Poor 57.8% |
| Immigrants | Colombia | 11.6 /100 | #214 | Poor 57.8% |
| Tongans | 11.6 /100 | #215 | Poor 57.8% |
| Immigrants | Peru | 10.6 /100 | #216 | Poor 57.7% |