Sudanese vs Immigrants from Mexico Single Female Poverty
COMPARE
Sudanese
Immigrants from Mexico
Single Female Poverty
Single Female Poverty Comparison
Sudanese
Immigrants from Mexico
22.6%
SINGLE FEMALE POVERTY
0.7/ 100
METRIC RATING
257th/ 347
METRIC RANK
25.3%
SINGLE FEMALE POVERTY
0.0/ 100
METRIC RATING
306th/ 347
METRIC RANK
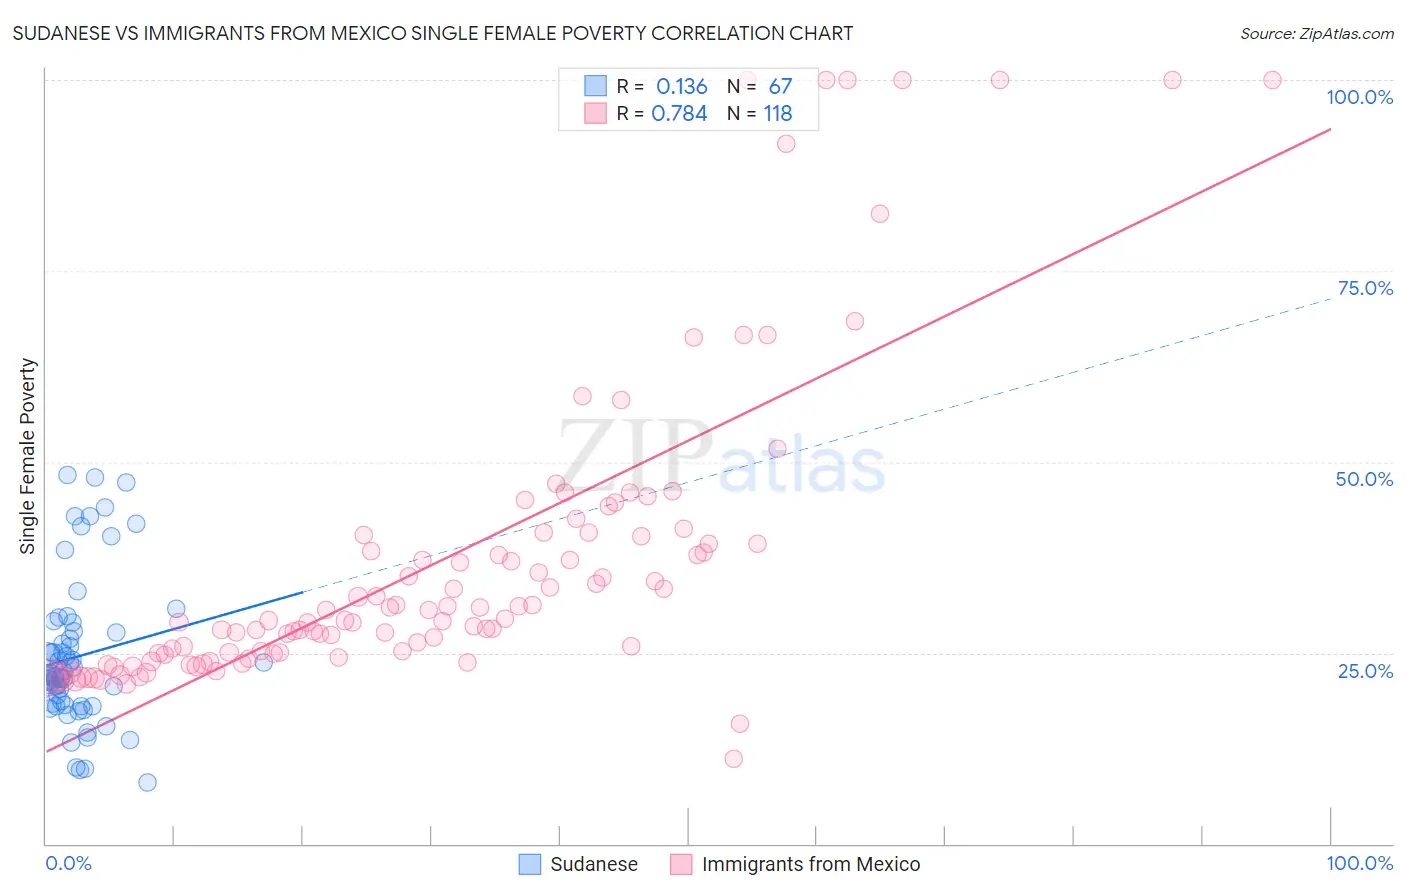
Sudanese vs Immigrants from Mexico Single Female Poverty Correlation Chart
The statistical analysis conducted on geographies consisting of 109,775,287 people shows a poor positive correlation between the proportion of Sudanese and poverty level among single females in the United States with a correlation coefficient (R) of 0.136 and weighted average of 22.6%. Similarly, the statistical analysis conducted on geographies consisting of 502,948,318 people shows a strong positive correlation between the proportion of Immigrants from Mexico and poverty level among single females in the United States with a correlation coefficient (R) of 0.784 and weighted average of 25.3%, a difference of 11.9%.
Single Female Poverty Correlation Summary
| Measurement | Sudanese | Immigrants from Mexico |
| Minimum | 8.0% | 11.1% |
| Maximum | 48.2% | 100.0% |
| Range | 40.2% | 88.9% |
| Mean | 24.5% | 37.1% |
| Median | 22.1% | 29.3% |
| Interquartile 25% (IQ1) | 18.2% | 24.9% |
| Interquartile 75% (IQ3) | 27.9% | 40.3% |
| Interquartile Range (IQR) | 9.7% | 15.4% |
| Standard Deviation (Sample) | 9.6% | 20.3% |
| Standard Deviation (Population) | 9.5% | 20.2% |
Similar Demographics by Single Female Poverty
Demographics Similar to Sudanese by Single Female Poverty
In terms of single female poverty, the demographic groups most similar to Sudanese are Immigrants from Belize (22.6%, a difference of 0.14%), Bahamian (22.7%, a difference of 0.20%), Immigrants from Burma/Myanmar (22.6%, a difference of 0.29%), Immigrants from Sudan (22.6%, a difference of 0.29%), and White/Caucasian (22.7%, a difference of 0.34%).
| Demographics | Rating | Rank | Single Female Poverty |
| Immigrants | Bahamas | 1.2 /100 | #250 | Tragic 22.5% |
| Immigrants | West Indies | 1.0 /100 | #251 | Tragic 22.5% |
| Delaware | 1.0 /100 | #252 | Tragic 22.5% |
| Immigrants | Liberia | 0.9 /100 | #253 | Tragic 22.5% |
| Immigrants | Burma/Myanmar | 0.8 /100 | #254 | Tragic 22.6% |
| Immigrants | Sudan | 0.8 /100 | #255 | Tragic 22.6% |
| Immigrants | Belize | 0.8 /100 | #256 | Tragic 22.6% |
| Sudanese | 0.7 /100 | #257 | Tragic 22.6% |
| Bahamians | 0.6 /100 | #258 | Tragic 22.7% |
| Whites/Caucasians | 0.6 /100 | #259 | Tragic 22.7% |
| Celtics | 0.5 /100 | #260 | Tragic 22.7% |
| Immigrants | Cabo Verde | 0.4 /100 | #261 | Tragic 22.8% |
| British West Indians | 0.4 /100 | #262 | Tragic 22.8% |
| Scotch-Irish | 0.3 /100 | #263 | Tragic 22.9% |
| Immigrants | Laos | 0.3 /100 | #264 | Tragic 22.9% |
Demographics Similar to Immigrants from Mexico by Single Female Poverty
In terms of single female poverty, the demographic groups most similar to Immigrants from Mexico are Immigrants from Dominican Republic (25.3%, a difference of 0.10%), Immigrants from Congo (25.3%, a difference of 0.11%), Potawatomi (25.4%, a difference of 0.23%), Somali (25.2%, a difference of 0.38%), and Aleut (25.4%, a difference of 0.39%).
| Demographics | Rating | Rank | Single Female Poverty |
| Mexicans | 0.0 /100 | #299 | Tragic 25.0% |
| Blackfeet | 0.0 /100 | #300 | Tragic 25.1% |
| Hondurans | 0.0 /100 | #301 | Tragic 25.1% |
| Shoshone | 0.0 /100 | #302 | Tragic 25.1% |
| Somalis | 0.0 /100 | #303 | Tragic 25.2% |
| Immigrants | Congo | 0.0 /100 | #304 | Tragic 25.3% |
| Immigrants | Dominican Republic | 0.0 /100 | #305 | Tragic 25.3% |
| Immigrants | Mexico | 0.0 /100 | #306 | Tragic 25.3% |
| Potawatomi | 0.0 /100 | #307 | Tragic 25.4% |
| Aleuts | 0.0 /100 | #308 | Tragic 25.4% |
| Dominicans | 0.0 /100 | #309 | Tragic 25.4% |
| Central American Indians | 0.0 /100 | #310 | Tragic 25.5% |
| Immigrants | Honduras | 0.0 /100 | #311 | Tragic 25.5% |
| Paiute | 0.0 /100 | #312 | Tragic 25.5% |
| Comanche | 0.0 /100 | #313 | Tragic 25.6% |