Black/African American vs Osage Child Poverty Among Boys Under 16
COMPARE
Black/African American
Osage
Child Poverty Among Boys Under 16
Child Poverty Among Boys Under 16 Comparison
Blacks/African Americans
Osage
24.5%
CHILD POVERTY AMONG BOYS UNDER 16
0.0/ 100
METRIC RATING
334th/ 347
METRIC RANK
17.7%
CHILD POVERTY AMONG BOYS UNDER 16
5.8/ 100
METRIC RATING
215th/ 347
METRIC RANK
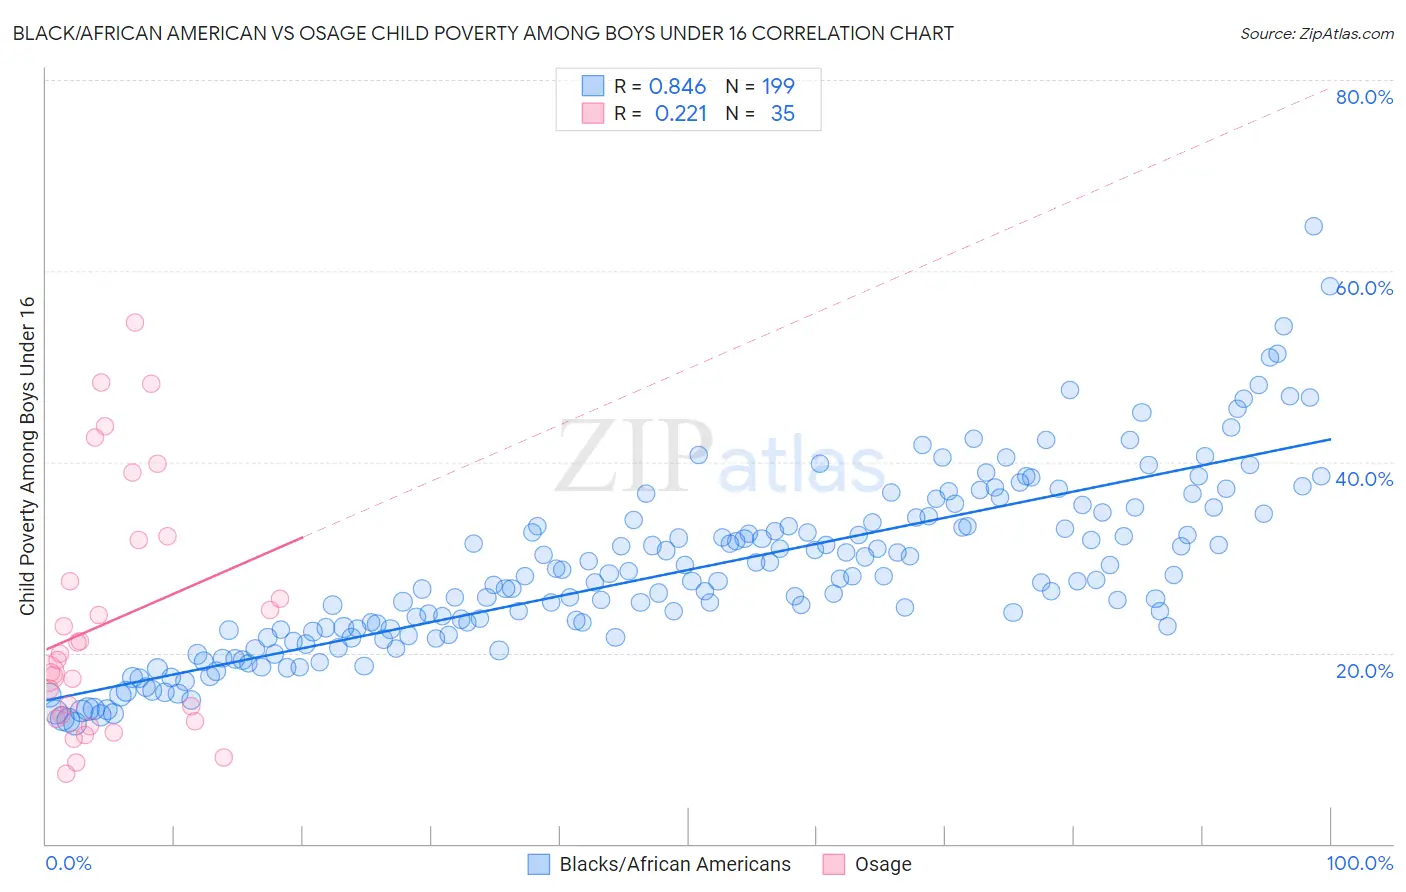
Black/African American vs Osage Child Poverty Among Boys Under 16 Correlation Chart
The statistical analysis conducted on geographies consisting of 548,051,875 people shows a very strong positive correlation between the proportion of Blacks/African Americans and poverty level among boys under the age of 16 in the United States with a correlation coefficient (R) of 0.846 and weighted average of 24.5%. Similarly, the statistical analysis conducted on geographies consisting of 91,574,378 people shows a weak positive correlation between the proportion of Osage and poverty level among boys under the age of 16 in the United States with a correlation coefficient (R) of 0.221 and weighted average of 17.7%, a difference of 38.5%.
Child Poverty Among Boys Under 16 Correlation Summary
| Measurement | Black/African American | Osage |
| Minimum | 12.5% | 7.4% |
| Maximum | 64.6% | 54.5% |
| Range | 52.1% | 47.2% |
| Mean | 28.6% | 23.2% |
| Median | 27.6% | 19.3% |
| Interquartile 25% (IQ1) | 21.9% | 13.1% |
| Interquartile 75% (IQ3) | 34.0% | 31.9% |
| Interquartile Range (IQR) | 12.1% | 18.8% |
| Standard Deviation (Sample) | 9.3% | 12.8% |
| Standard Deviation (Population) | 9.3% | 12.7% |
Similar Demographics by Child Poverty Among Boys Under 16
Demographics Similar to Blacks/African Americans by Child Poverty Among Boys Under 16
In terms of child poverty among boys under 16, the demographic groups most similar to Blacks/African Americans are Apache (24.5%, a difference of 0.12%), Immigrants from Dominican Republic (24.3%, a difference of 0.84%), Yup'ik (24.7%, a difference of 0.85%), Dominican (24.2%, a difference of 1.4%), and Colville (24.1%, a difference of 1.8%).
| Demographics | Rating | Rank | Child Poverty Among Boys Under 16 |
| Immigrants | Honduras | 0.0 /100 | #327 | Tragic 22.8% |
| Pueblo | 0.0 /100 | #328 | Tragic 23.5% |
| Natives/Alaskans | 0.0 /100 | #329 | Tragic 24.0% |
| Colville | 0.0 /100 | #330 | Tragic 24.1% |
| Dominicans | 0.0 /100 | #331 | Tragic 24.2% |
| Immigrants | Dominican Republic | 0.0 /100 | #332 | Tragic 24.3% |
| Apache | 0.0 /100 | #333 | Tragic 24.5% |
| Blacks/African Americans | 0.0 /100 | #334 | Tragic 24.5% |
| Yup'ik | 0.0 /100 | #335 | Tragic 24.7% |
| Sioux | 0.0 /100 | #336 | Tragic 25.3% |
| Cheyenne | 0.0 /100 | #337 | Tragic 25.8% |
| Hopi | 0.0 /100 | #338 | Tragic 25.9% |
| Houma | 0.0 /100 | #339 | Tragic 26.2% |
| Crow | 0.0 /100 | #340 | Tragic 26.3% |
| Immigrants | Yemen | 0.0 /100 | #341 | Tragic 28.9% |
Demographics Similar to Osage by Child Poverty Among Boys Under 16
In terms of child poverty among boys under 16, the demographic groups most similar to Osage are Panamanian (17.7%, a difference of 0.070%), Immigrants from Eastern Africa (17.7%, a difference of 0.080%), Moroccan (17.7%, a difference of 0.090%), Japanese (17.7%, a difference of 0.12%), and Iraqi (17.7%, a difference of 0.14%).
| Demographics | Rating | Rank | Child Poverty Among Boys Under 16 |
| Malaysians | 7.6 /100 | #208 | Tragic 17.6% |
| Alaskan Athabascans | 7.3 /100 | #209 | Tragic 17.6% |
| Immigrants | Armenia | 6.8 /100 | #210 | Tragic 17.6% |
| Immigrants | Immigrants | 6.7 /100 | #211 | Tragic 17.6% |
| Aleuts | 6.6 /100 | #212 | Tragic 17.7% |
| Immigrants | Eastern Africa | 6.0 /100 | #213 | Tragic 17.7% |
| Panamanians | 5.9 /100 | #214 | Tragic 17.7% |
| Osage | 5.8 /100 | #215 | Tragic 17.7% |
| Moroccans | 5.6 /100 | #216 | Tragic 17.7% |
| Japanese | 5.5 /100 | #217 | Tragic 17.7% |
| Iraqis | 5.5 /100 | #218 | Tragic 17.7% |
| Sierra Leoneans | 5.3 /100 | #219 | Tragic 17.8% |
| Immigrants | Cambodia | 5.1 /100 | #220 | Tragic 17.8% |
| Immigrants | Panama | 4.3 /100 | #221 | Tragic 17.9% |
| Pennsylvania Germans | 3.9 /100 | #222 | Tragic 17.9% |