Immigrants from Colombia vs Immigrants from Venezuela Single Female Poverty
COMPARE
Immigrants from Colombia
Immigrants from Venezuela
Single Female Poverty
Single Female Poverty Comparison
Immigrants from Colombia
Immigrants from Venezuela
20.0%
SINGLE FEMALE POVERTY
95.9/ 100
METRIC RATING
114th/ 347
METRIC RANK
20.2%
SINGLE FEMALE POVERTY
91.5/ 100
METRIC RATING
134th/ 347
METRIC RANK
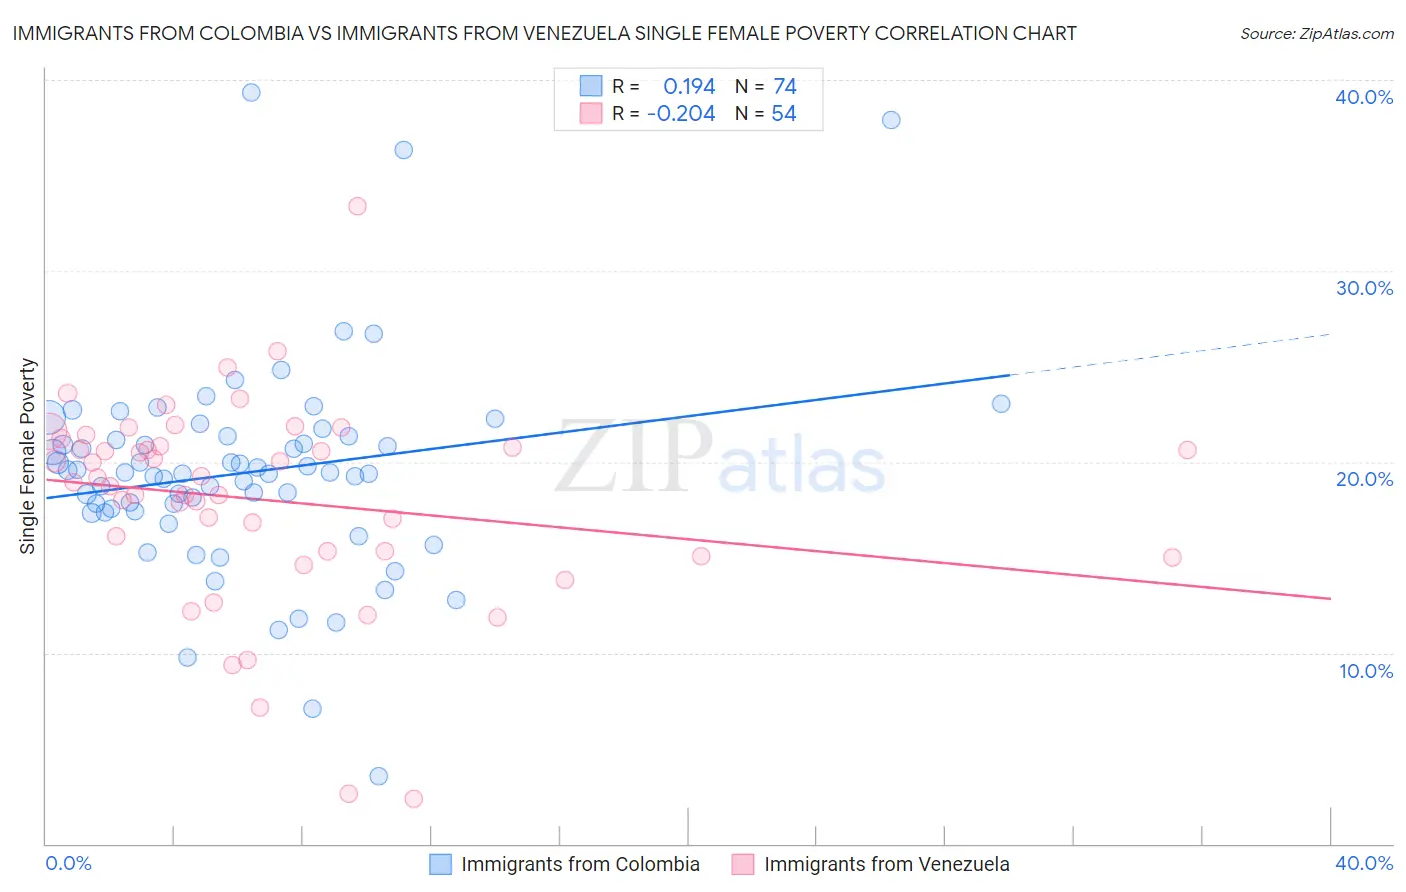
Immigrants from Colombia vs Immigrants from Venezuela Single Female Poverty Correlation Chart
The statistical analysis conducted on geographies consisting of 373,438,404 people shows a poor positive correlation between the proportion of Immigrants from Colombia and poverty level among single females in the United States with a correlation coefficient (R) of 0.194 and weighted average of 20.0%. Similarly, the statistical analysis conducted on geographies consisting of 285,137,962 people shows a weak negative correlation between the proportion of Immigrants from Venezuela and poverty level among single females in the United States with a correlation coefficient (R) of -0.204 and weighted average of 20.2%, a difference of 1.3%.
Single Female Poverty Correlation Summary
| Measurement | Immigrants from Colombia | Immigrants from Venezuela |
| Minimum | 3.5% | 2.3% |
| Maximum | 39.4% | 33.4% |
| Range | 35.8% | 31.0% |
| Mean | 19.4% | 18.0% |
| Median | 19.4% | 19.0% |
| Interquartile 25% (IQ1) | 17.4% | 15.3% |
| Interquartile 75% (IQ3) | 21.3% | 20.8% |
| Interquartile Range (IQR) | 3.9% | 5.5% |
| Standard Deviation (Sample) | 5.6% | 5.4% |
| Standard Deviation (Population) | 5.5% | 5.4% |
Demographics Similar to Immigrants from Colombia and Immigrants from Venezuela by Single Female Poverty
In terms of single female poverty, the demographic groups most similar to Immigrants from Colombia are Immigrants from Northern Africa (20.0%, a difference of 0.010%), Immigrants from Kazakhstan (20.0%, a difference of 0.050%), Polish (20.0%, a difference of 0.10%), Immigrants from Afghanistan (20.0%, a difference of 0.17%), and Immigrants from Ethiopia (20.0%, a difference of 0.18%). Similarly, the demographic groups most similar to Immigrants from Venezuela are Immigrants from England (20.2%, a difference of 0.090%), Pakistani (20.2%, a difference of 0.12%), Uruguayan (20.2%, a difference of 0.12%), Immigrants from Hungary (20.2%, a difference of 0.18%), and Immigrants from Morocco (20.2%, a difference of 0.20%).
| Demographics | Rating | Rank | Single Female Poverty |
| Immigrants | Colombia | 95.9 /100 | #114 | Exceptional 20.0% |
| Immigrants | Northern Africa | 95.8 /100 | #115 | Exceptional 20.0% |
| Immigrants | Kazakhstan | 95.7 /100 | #116 | Exceptional 20.0% |
| Poles | 95.6 /100 | #117 | Exceptional 20.0% |
| Immigrants | Afghanistan | 95.4 /100 | #118 | Exceptional 20.0% |
| Immigrants | Ethiopia | 95.4 /100 | #119 | Exceptional 20.0% |
| South Americans | 95.1 /100 | #120 | Exceptional 20.0% |
| Immigrants | Switzerland | 95.1 /100 | #121 | Exceptional 20.0% |
| Immigrants | South America | 95.0 /100 | #122 | Exceptional 20.0% |
| Brazilians | 94.4 /100 | #123 | Exceptional 20.1% |
| Immigrants | Chile | 94.3 /100 | #124 | Exceptional 20.1% |
| Immigrants | South Africa | 93.9 /100 | #125 | Exceptional 20.1% |
| Serbians | 93.3 /100 | #126 | Exceptional 20.1% |
| Mongolians | 93.2 /100 | #127 | Exceptional 20.2% |
| Immigrants | Spain | 92.7 /100 | #128 | Exceptional 20.2% |
| Immigrants | Morocco | 92.4 /100 | #129 | Exceptional 20.2% |
| Immigrants | Hungary | 92.3 /100 | #130 | Exceptional 20.2% |
| Pakistanis | 92.1 /100 | #131 | Exceptional 20.2% |
| Uruguayans | 92.1 /100 | #132 | Exceptional 20.2% |
| Immigrants | England | 91.9 /100 | #133 | Exceptional 20.2% |
| Immigrants | Venezuela | 91.5 /100 | #134 | Exceptional 20.2% |