Sioux vs Immigrants from Pakistan Single Father Poverty
COMPARE
Sioux
Immigrants from Pakistan
Single Father Poverty
Single Father Poverty Comparison
Sioux
Immigrants from Pakistan
23.9%
SINGLE FATHER POVERTY
0.0/ 100
METRIC RATING
337th/ 347
METRIC RANK
15.0%
SINGLE FATHER POVERTY
99.9/ 100
METRIC RATING
51st/ 347
METRIC RANK
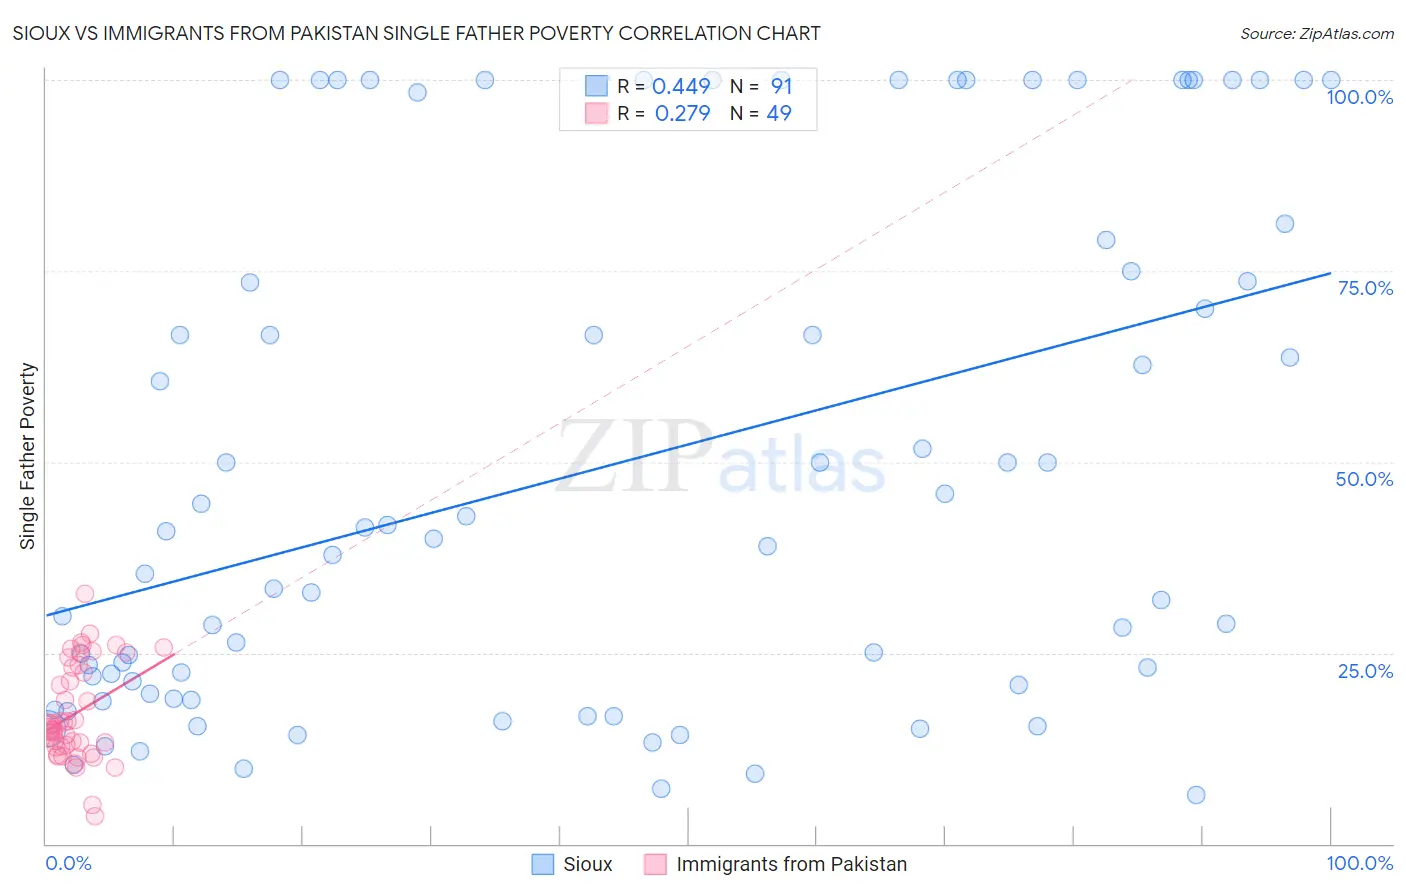
Sioux vs Immigrants from Pakistan Single Father Poverty Correlation Chart
The statistical analysis conducted on geographies consisting of 199,784,577 people shows a moderate positive correlation between the proportion of Sioux and poverty level among single fathers in the United States with a correlation coefficient (R) of 0.449 and weighted average of 23.9%. Similarly, the statistical analysis conducted on geographies consisting of 230,495,703 people shows a weak positive correlation between the proportion of Immigrants from Pakistan and poverty level among single fathers in the United States with a correlation coefficient (R) of 0.279 and weighted average of 15.0%, a difference of 59.5%.
Single Father Poverty Correlation Summary
| Measurement | Sioux | Immigrants from Pakistan |
| Minimum | 6.4% | 3.7% |
| Maximum | 100.0% | 32.8% |
| Range | 93.6% | 29.1% |
| Mean | 49.3% | 17.1% |
| Median | 40.0% | 15.2% |
| Interquartile 25% (IQ1) | 19.7% | 12.7% |
| Interquartile 75% (IQ3) | 79.0% | 23.2% |
| Interquartile Range (IQR) | 59.4% | 10.5% |
| Standard Deviation (Sample) | 33.2% | 6.4% |
| Standard Deviation (Population) | 33.1% | 6.3% |
Similar Demographics by Single Father Poverty
Demographics Similar to Sioux by Single Father Poverty
In terms of single father poverty, the demographic groups most similar to Sioux are Arapaho (24.0%, a difference of 0.41%), Apache (24.2%, a difference of 1.5%), Cajun (23.1%, a difference of 3.5%), Shoshone (22.9%, a difference of 4.2%), and Kiowa (22.5%, a difference of 6.3%).
| Demographics | Rating | Rank | Single Father Poverty |
| Paiute | 0.0 /100 | #330 | Tragic 21.6% |
| Central American Indians | 0.0 /100 | #331 | Tragic 21.7% |
| Tohono O'odham | 0.0 /100 | #332 | Tragic 22.0% |
| Natives/Alaskans | 0.0 /100 | #333 | Tragic 22.4% |
| Kiowa | 0.0 /100 | #334 | Tragic 22.5% |
| Shoshone | 0.0 /100 | #335 | Tragic 22.9% |
| Cajuns | 0.0 /100 | #336 | Tragic 23.1% |
| Sioux | 0.0 /100 | #337 | Tragic 23.9% |
| Arapaho | 0.0 /100 | #338 | Tragic 24.0% |
| Apache | 0.0 /100 | #339 | Tragic 24.2% |
| Houma | 0.0 /100 | #340 | Tragic 26.7% |
| Hopi | 0.0 /100 | #341 | Tragic 27.2% |
| Yuman | 0.0 /100 | #342 | Tragic 28.4% |
| Lumbee | 0.0 /100 | #343 | Tragic 28.5% |
| Navajo | 0.0 /100 | #344 | Tragic 29.2% |
Demographics Similar to Immigrants from Pakistan by Single Father Poverty
In terms of single father poverty, the demographic groups most similar to Immigrants from Pakistan are Bhutanese (15.0%, a difference of 0.020%), Immigrants from El Salvador (15.0%, a difference of 0.040%), Immigrants from Eastern Asia (15.0%, a difference of 0.070%), Immigrants from Kenya (15.0%, a difference of 0.070%), and Immigrants from China (14.9%, a difference of 0.23%).
| Demographics | Rating | Rank | Single Father Poverty |
| Salvadorans | 100.0 /100 | #44 | Exceptional 14.9% |
| Immigrants | Somalia | 100.0 /100 | #45 | Exceptional 14.9% |
| Immigrants | Cambodia | 99.9 /100 | #46 | Exceptional 14.9% |
| Immigrants | China | 99.9 /100 | #47 | Exceptional 14.9% |
| Malaysians | 99.9 /100 | #48 | Exceptional 14.9% |
| Immigrants | Eastern Asia | 99.9 /100 | #49 | Exceptional 15.0% |
| Bhutanese | 99.9 /100 | #50 | Exceptional 15.0% |
| Immigrants | Pakistan | 99.9 /100 | #51 | Exceptional 15.0% |
| Immigrants | El Salvador | 99.9 /100 | #52 | Exceptional 15.0% |
| Immigrants | Kenya | 99.9 /100 | #53 | Exceptional 15.0% |
| Immigrants | Uzbekistan | 99.9 /100 | #54 | Exceptional 15.0% |
| Immigrants | Bulgaria | 99.9 /100 | #55 | Exceptional 15.0% |
| Immigrants | Laos | 99.9 /100 | #56 | Exceptional 15.1% |
| Laotians | 99.9 /100 | #57 | Exceptional 15.1% |
| Hawaiians | 99.9 /100 | #58 | Exceptional 15.1% |