Subsaharan African vs Immigrants from Pakistan Householder Income Ages 25 - 44 years
COMPARE
Subsaharan African
Immigrants from Pakistan
Householder Income Ages 25 - 44 years
Householder Income Ages 25 - 44 years Comparison
Sub-Saharan Africans
Immigrants from Pakistan
$84,235
HOUSEHOLDER INCOME AGES 25 - 44 YEARS
0.3/ 100
METRIC RATING
268th/ 347
METRIC RANK
$106,129
HOUSEHOLDER INCOME AGES 25 - 44 YEARS
99.8/ 100
METRIC RATING
56th/ 347
METRIC RANK
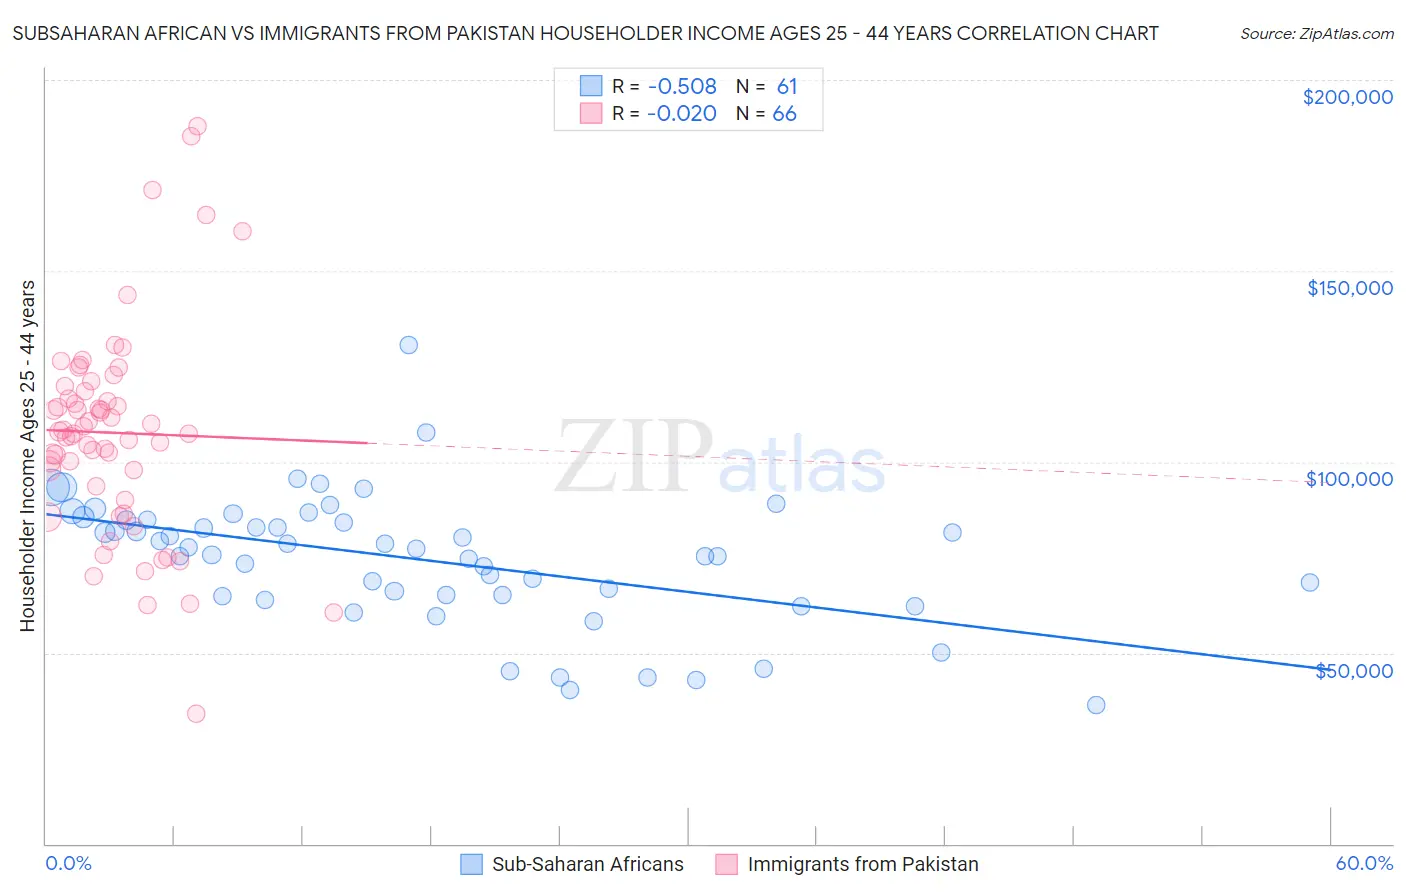
Subsaharan African vs Immigrants from Pakistan Householder Income Ages 25 - 44 years Correlation Chart
The statistical analysis conducted on geographies consisting of 505,523,200 people shows a substantial negative correlation between the proportion of Sub-Saharan Africans and household income with householder between the ages 25 and 44 in the United States with a correlation coefficient (R) of -0.508 and weighted average of $84,235. Similarly, the statistical analysis conducted on geographies consisting of 283,570,722 people shows no correlation between the proportion of Immigrants from Pakistan and household income with householder between the ages 25 and 44 in the United States with a correlation coefficient (R) of -0.020 and weighted average of $106,129, a difference of 26.0%.
Householder Income Ages 25 - 44 years Correlation Summary
| Measurement | Subsaharan African | Immigrants from Pakistan |
| Minimum | $36,409 | $34,000 |
| Maximum | $130,453 | $187,880 |
| Range | $94,044 | $153,880 |
| Mean | $74,443 | $107,614 |
| Median | $77,380 | $107,714 |
| Interquartile 25% (IQ1) | $65,093 | $93,459 |
| Interquartile 75% (IQ3) | $84,848 | $118,512 |
| Interquartile Range (IQR) | $19,755 | $25,052 |
| Standard Deviation (Sample) | $17,109 | $27,793 |
| Standard Deviation (Population) | $16,968 | $27,582 |
Similar Demographics by Householder Income Ages 25 - 44 years
Demographics Similar to Sub-Saharan Africans by Householder Income Ages 25 - 44 years
In terms of householder income ages 25 - 44 years, the demographic groups most similar to Sub-Saharan Africans are Hmong ($84,258, a difference of 0.030%), Immigrants from Cabo Verde ($84,304, a difference of 0.080%), Spanish American Indian ($84,085, a difference of 0.18%), Sudanese ($84,401, a difference of 0.20%), and Osage ($84,461, a difference of 0.27%).
| Demographics | Rating | Rank | Householder Income Ages 25 - 44 years |
| Inupiat | 0.4 /100 | #261 | Tragic $84,619 |
| Cree | 0.4 /100 | #262 | Tragic $84,574 |
| Belizeans | 0.4 /100 | #263 | Tragic $84,534 |
| Osage | 0.4 /100 | #264 | Tragic $84,461 |
| Sudanese | 0.4 /100 | #265 | Tragic $84,401 |
| Immigrants | Cabo Verde | 0.3 /100 | #266 | Tragic $84,304 |
| Hmong | 0.3 /100 | #267 | Tragic $84,258 |
| Sub-Saharan Africans | 0.3 /100 | #268 | Tragic $84,235 |
| Spanish American Indians | 0.3 /100 | #269 | Tragic $84,085 |
| Jamaicans | 0.3 /100 | #270 | Tragic $83,933 |
| Somalis | 0.2 /100 | #271 | Tragic $83,752 |
| Spanish Americans | 0.2 /100 | #272 | Tragic $83,722 |
| Iroquois | 0.2 /100 | #273 | Tragic $83,682 |
| Marshallese | 0.2 /100 | #274 | Tragic $83,575 |
| Immigrants | Jamaica | 0.2 /100 | #275 | Tragic $83,298 |
Demographics Similar to Immigrants from Pakistan by Householder Income Ages 25 - 44 years
In terms of householder income ages 25 - 44 years, the demographic groups most similar to Immigrants from Pakistan are Immigrants from Austria ($106,103, a difference of 0.030%), Greek ($106,457, a difference of 0.31%), Immigrants from South Africa ($105,748, a difference of 0.36%), Paraguayan ($106,615, a difference of 0.46%), and Immigrants from Norway ($106,629, a difference of 0.47%).
| Demographics | Rating | Rank | Householder Income Ages 25 - 44 years |
| Immigrants | Turkey | 99.9 /100 | #49 | Exceptional $107,258 |
| Cambodians | 99.9 /100 | #50 | Exceptional $107,148 |
| Immigrants | Czechoslovakia | 99.9 /100 | #51 | Exceptional $106,888 |
| Immigrants | Europe | 99.9 /100 | #52 | Exceptional $106,817 |
| Immigrants | Norway | 99.9 /100 | #53 | Exceptional $106,629 |
| Paraguayans | 99.9 /100 | #54 | Exceptional $106,615 |
| Greeks | 99.9 /100 | #55 | Exceptional $106,457 |
| Immigrants | Pakistan | 99.8 /100 | #56 | Exceptional $106,129 |
| Immigrants | Austria | 99.8 /100 | #57 | Exceptional $106,103 |
| Immigrants | South Africa | 99.8 /100 | #58 | Exceptional $105,748 |
| Immigrants | Latvia | 99.8 /100 | #59 | Exceptional $105,522 |
| Egyptians | 99.7 /100 | #60 | Exceptional $105,282 |
| Lithuanians | 99.7 /100 | #61 | Exceptional $105,223 |
| Immigrants | Italy | 99.7 /100 | #62 | Exceptional $105,201 |
| Immigrants | Scotland | 99.7 /100 | #63 | Exceptional $105,089 |