Sri Lankan vs Immigrants from Costa Rica Child Poverty Among Girls Under 16
COMPARE
Sri Lankan
Immigrants from Costa Rica
Child Poverty Among Girls Under 16
Child Poverty Among Girls Under 16 Comparison
Sri Lankans
Immigrants from Costa Rica
15.2%
CHILD POVERTY AMONG GIRLS UNDER 16
94.0/ 100
METRIC RATING
114th/ 347
METRIC RANK
17.0%
CHILD POVERTY AMONG GIRLS UNDER 16
25.6/ 100
METRIC RATING
195th/ 347
METRIC RANK
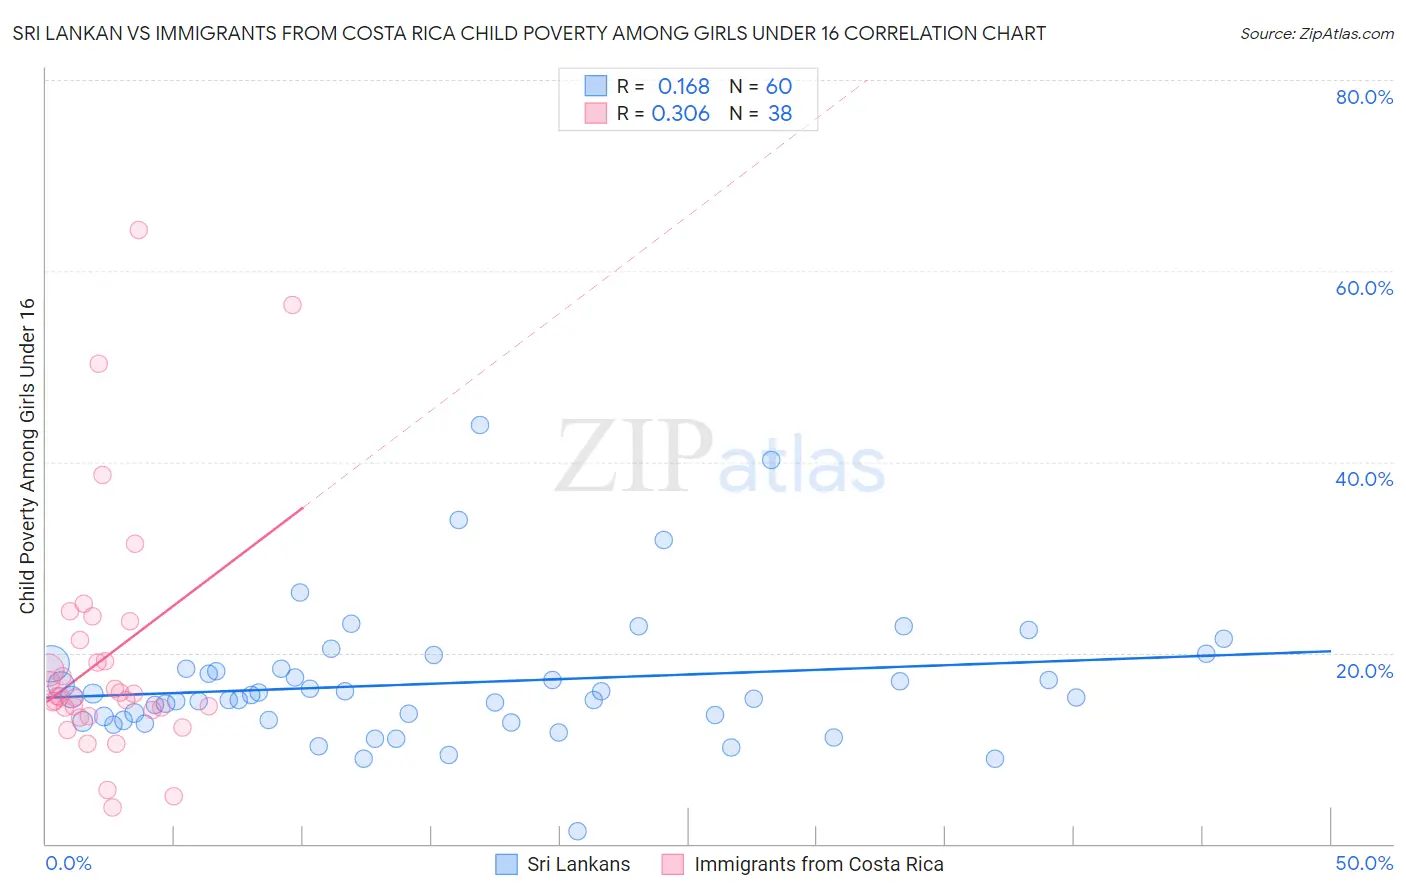
Sri Lankan vs Immigrants from Costa Rica Child Poverty Among Girls Under 16 Correlation Chart
The statistical analysis conducted on geographies consisting of 432,135,013 people shows a poor positive correlation between the proportion of Sri Lankans and poverty level among girls under the age of 16 in the United States with a correlation coefficient (R) of 0.168 and weighted average of 15.2%. Similarly, the statistical analysis conducted on geographies consisting of 202,693,762 people shows a mild positive correlation between the proportion of Immigrants from Costa Rica and poverty level among girls under the age of 16 in the United States with a correlation coefficient (R) of 0.306 and weighted average of 17.0%, a difference of 11.9%.
Child Poverty Among Girls Under 16 Correlation Summary
| Measurement | Sri Lankan | Immigrants from Costa Rica |
| Minimum | 1.3% | 3.7% |
| Maximum | 43.9% | 64.3% |
| Range | 42.6% | 60.5% |
| Mean | 16.8% | 19.6% |
| Median | 15.3% | 15.5% |
| Interquartile 25% (IQ1) | 12.9% | 14.1% |
| Interquartile 75% (IQ3) | 18.4% | 21.3% |
| Interquartile Range (IQR) | 5.4% | 7.2% |
| Standard Deviation (Sample) | 7.0% | 13.0% |
| Standard Deviation (Population) | 7.0% | 12.8% |
Similar Demographics by Child Poverty Among Girls Under 16
Demographics Similar to Sri Lankans by Child Poverty Among Girls Under 16
In terms of child poverty among girls under 16, the demographic groups most similar to Sri Lankans are Belgian (15.2%, a difference of 0.060%), Dutch (15.1%, a difference of 0.13%), Immigrants from Kazakhstan (15.1%, a difference of 0.15%), Palestinian (15.1%, a difference of 0.29%), and Immigrants from Croatia (15.1%, a difference of 0.34%).
| Demographics | Rating | Rank | Child Poverty Among Girls Under 16 |
| Immigrants | Ukraine | 95.0 /100 | #107 | Exceptional 15.1% |
| Immigrants | Brazil | 94.9 /100 | #108 | Exceptional 15.1% |
| Serbians | 94.8 /100 | #109 | Exceptional 15.1% |
| Immigrants | Croatia | 94.6 /100 | #110 | Exceptional 15.1% |
| Palestinians | 94.5 /100 | #111 | Exceptional 15.1% |
| Immigrants | Kazakhstan | 94.3 /100 | #112 | Exceptional 15.1% |
| Dutch | 94.3 /100 | #113 | Exceptional 15.1% |
| Sri Lankans | 94.0 /100 | #114 | Exceptional 15.2% |
| Belgians | 93.9 /100 | #115 | Exceptional 15.2% |
| Immigrants | Denmark | 93.3 /100 | #116 | Exceptional 15.2% |
| Immigrants | North Macedonia | 93.1 /100 | #117 | Exceptional 15.2% |
| Immigrants | Southern Europe | 92.7 /100 | #118 | Exceptional 15.3% |
| Immigrants | Zimbabwe | 92.5 /100 | #119 | Exceptional 15.3% |
| Pakistanis | 92.3 /100 | #120 | Exceptional 15.3% |
| English | 92.2 /100 | #121 | Exceptional 15.3% |
Demographics Similar to Immigrants from Costa Rica by Child Poverty Among Girls Under 16
In terms of child poverty among girls under 16, the demographic groups most similar to Immigrants from Costa Rica are Celtic (17.0%, a difference of 0.050%), Spaniard (17.0%, a difference of 0.11%), Spanish (16.9%, a difference of 0.43%), Aleut (16.9%, a difference of 0.44%), and Immigrants from Lebanon (17.1%, a difference of 0.46%).
| Demographics | Rating | Rank | Child Poverty Among Girls Under 16 |
| Arabs | 34.5 /100 | #188 | Fair 16.8% |
| Immigrants | Bosnia and Herzegovina | 32.5 /100 | #189 | Fair 16.8% |
| Kenyans | 32.3 /100 | #190 | Fair 16.8% |
| Immigrants | Azores | 31.3 /100 | #191 | Fair 16.8% |
| Immigrants | Uganda | 31.3 /100 | #192 | Fair 16.8% |
| Aleuts | 28.7 /100 | #193 | Fair 16.9% |
| Spanish | 28.6 /100 | #194 | Fair 16.9% |
| Immigrants | Costa Rica | 25.6 /100 | #195 | Fair 17.0% |
| Celtics | 25.2 /100 | #196 | Fair 17.0% |
| Spaniards | 24.9 /100 | #197 | Fair 17.0% |
| Immigrants | Lebanon | 22.6 /100 | #198 | Fair 17.1% |
| Immigrants | Afghanistan | 22.4 /100 | #199 | Fair 17.1% |
| Immigrants | Uzbekistan | 21.5 /100 | #200 | Fair 17.1% |
| Immigrants | Kenya | 17.8 /100 | #201 | Poor 17.2% |
| Immigrants | Sierra Leone | 17.6 /100 | #202 | Poor 17.2% |