Sri Lankan vs Immigrants from Switzerland Child Poverty Among Girls Under 16
COMPARE
Sri Lankan
Immigrants from Switzerland
Child Poverty Among Girls Under 16
Child Poverty Among Girls Under 16 Comparison
Sri Lankans
Immigrants from Switzerland
15.2%
CHILD POVERTY AMONG GIRLS UNDER 16
94.0/ 100
METRIC RATING
114th/ 347
METRIC RANK
14.9%
CHILD POVERTY AMONG GIRLS UNDER 16
96.3/ 100
METRIC RATING
94th/ 347
METRIC RANK
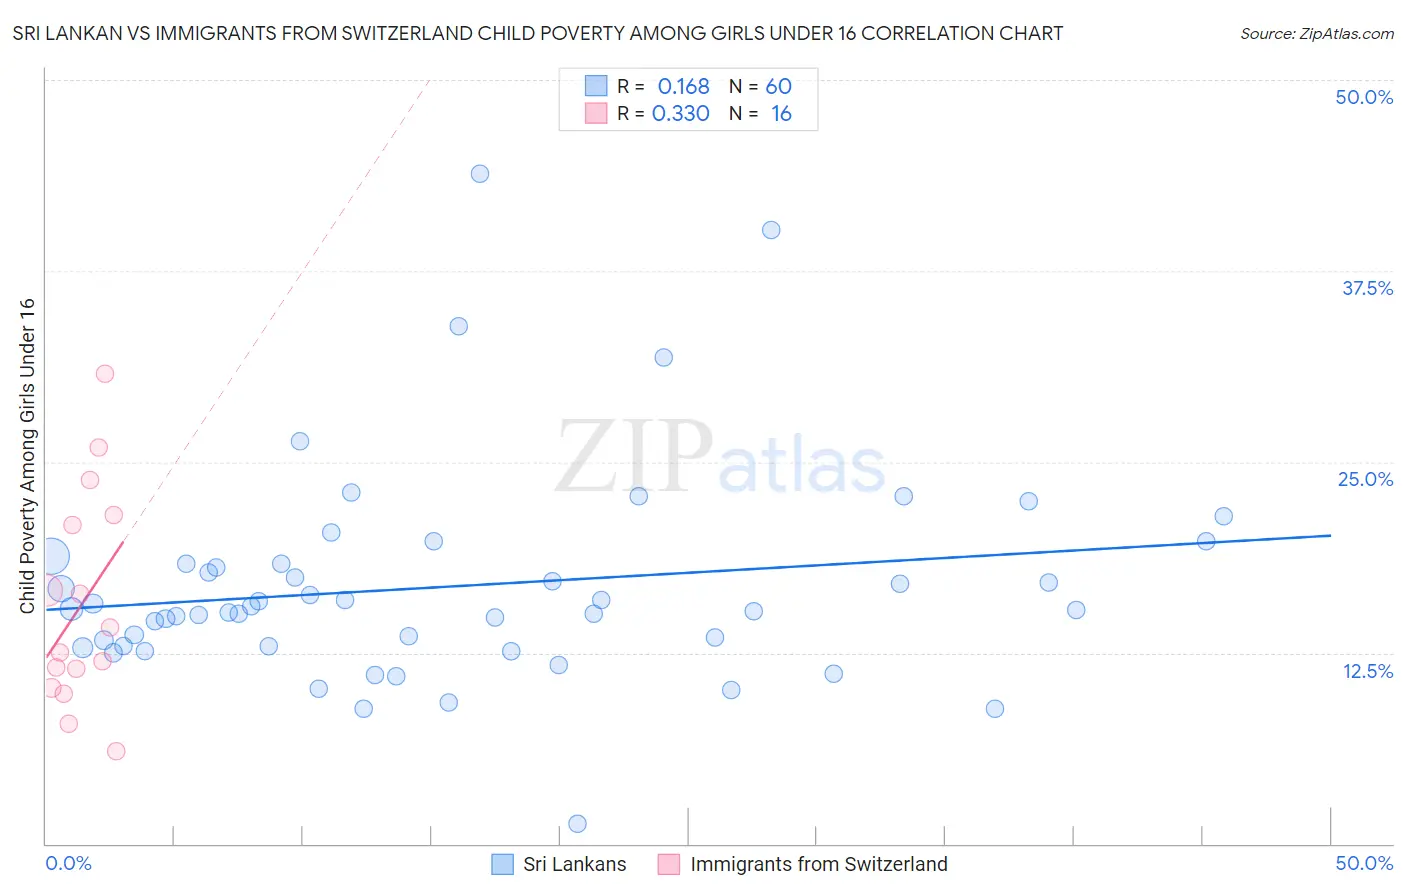
Sri Lankan vs Immigrants from Switzerland Child Poverty Among Girls Under 16 Correlation Chart
The statistical analysis conducted on geographies consisting of 432,135,013 people shows a poor positive correlation between the proportion of Sri Lankans and poverty level among girls under the age of 16 in the United States with a correlation coefficient (R) of 0.168 and weighted average of 15.2%. Similarly, the statistical analysis conducted on geographies consisting of 146,269,964 people shows a mild positive correlation between the proportion of Immigrants from Switzerland and poverty level among girls under the age of 16 in the United States with a correlation coefficient (R) of 0.330 and weighted average of 14.9%, a difference of 1.6%.
Child Poverty Among Girls Under 16 Correlation Summary
| Measurement | Sri Lankan | Immigrants from Switzerland |
| Minimum | 1.3% | 6.1% |
| Maximum | 43.9% | 30.8% |
| Range | 42.6% | 24.7% |
| Mean | 16.8% | 15.7% |
| Median | 15.3% | 13.3% |
| Interquartile 25% (IQ1) | 12.9% | 10.8% |
| Interquartile 75% (IQ3) | 18.4% | 21.2% |
| Interquartile Range (IQR) | 5.4% | 10.3% |
| Standard Deviation (Sample) | 7.0% | 7.0% |
| Standard Deviation (Population) | 7.0% | 6.8% |
Demographics Similar to Sri Lankans and Immigrants from Switzerland by Child Poverty Among Girls Under 16
In terms of child poverty among girls under 16, the demographic groups most similar to Sri Lankans are Dutch (15.1%, a difference of 0.13%), Immigrants from Kazakhstan (15.1%, a difference of 0.15%), Palestinian (15.1%, a difference of 0.29%), Immigrants from Croatia (15.1%, a difference of 0.34%), and Serbian (15.1%, a difference of 0.46%). Similarly, the demographic groups most similar to Immigrants from Switzerland are German (14.9%, a difference of 0.020%), Immigrants from France (14.9%, a difference of 0.070%), Immigrants from Latvia (14.9%, a difference of 0.16%), Basque (15.0%, a difference of 0.34%), and Immigrants from Egypt (15.0%, a difference of 0.50%).
| Demographics | Rating | Rank | Child Poverty Among Girls Under 16 |
| Immigrants | Switzerland | 96.3 /100 | #94 | Exceptional 14.9% |
| Germans | 96.3 /100 | #95 | Exceptional 14.9% |
| Immigrants | France | 96.2 /100 | #96 | Exceptional 14.9% |
| Immigrants | Latvia | 96.1 /100 | #97 | Exceptional 14.9% |
| Basques | 95.9 /100 | #98 | Exceptional 15.0% |
| Immigrants | Egypt | 95.7 /100 | #99 | Exceptional 15.0% |
| Paraguayans | 95.7 /100 | #100 | Exceptional 15.0% |
| Immigrants | South Africa | 95.6 /100 | #101 | Exceptional 15.0% |
| Immigrants | Malaysia | 95.6 /100 | #102 | Exceptional 15.0% |
| British | 95.6 /100 | #103 | Exceptional 15.0% |
| Romanians | 95.3 /100 | #104 | Exceptional 15.0% |
| Immigrants | England | 95.1 /100 | #105 | Exceptional 15.1% |
| Chileans | 95.1 /100 | #106 | Exceptional 15.1% |
| Immigrants | Ukraine | 95.0 /100 | #107 | Exceptional 15.1% |
| Immigrants | Brazil | 94.9 /100 | #108 | Exceptional 15.1% |
| Serbians | 94.8 /100 | #109 | Exceptional 15.1% |
| Immigrants | Croatia | 94.6 /100 | #110 | Exceptional 15.1% |
| Palestinians | 94.5 /100 | #111 | Exceptional 15.1% |
| Immigrants | Kazakhstan | 94.3 /100 | #112 | Exceptional 15.1% |
| Dutch | 94.3 /100 | #113 | Exceptional 15.1% |
| Sri Lankans | 94.0 /100 | #114 | Exceptional 15.2% |