Sri Lankan vs Immigrants from Costa Rica Family Households with Children
COMPARE
Sri Lankan
Immigrants from Costa Rica
Family Households with Children
Family Households with Children Comparison
Sri Lankans
Immigrants from Costa Rica
29.5%
FAMILY HOUSEHOLDS WITH CHILDREN
100.0/ 100
METRIC RATING
26th/ 347
METRIC RANK
28.3%
FAMILY HOUSEHOLDS WITH CHILDREN
99.6/ 100
METRIC RATING
89th/ 347
METRIC RANK
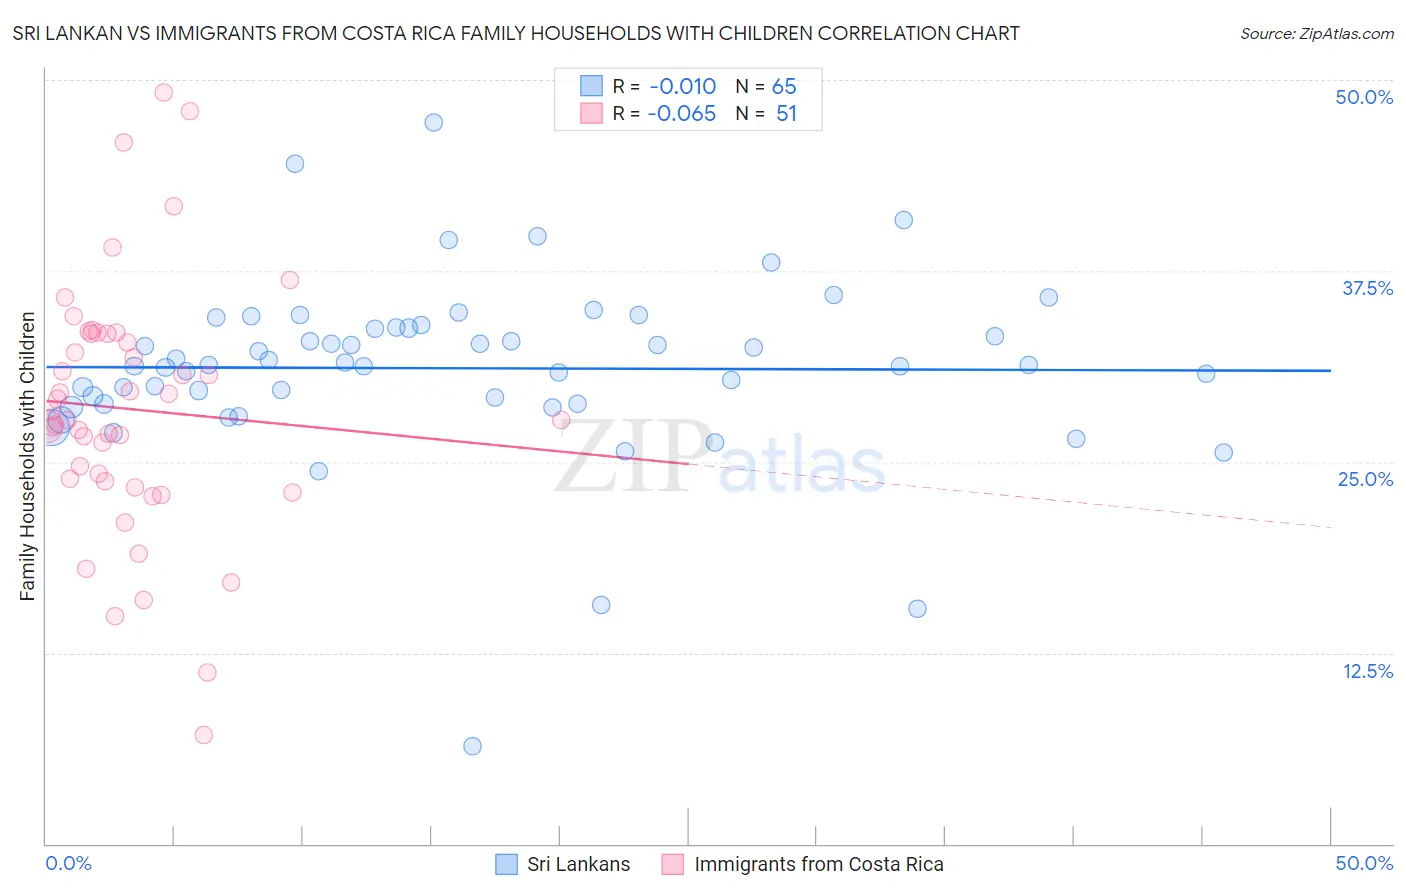
Sri Lankan vs Immigrants from Costa Rica Family Households with Children Correlation Chart
The statistical analysis conducted on geographies consisting of 439,896,469 people shows no correlation between the proportion of Sri Lankans and percentage of family households with children in the United States with a correlation coefficient (R) of -0.010 and weighted average of 29.5%. Similarly, the statistical analysis conducted on geographies consisting of 204,199,597 people shows a slight negative correlation between the proportion of Immigrants from Costa Rica and percentage of family households with children in the United States with a correlation coefficient (R) of -0.065 and weighted average of 28.3%, a difference of 4.5%.
Family Households with Children Correlation Summary
| Measurement | Sri Lankan | Immigrants from Costa Rica |
| Minimum | 6.4% | 7.1% |
| Maximum | 47.2% | 49.2% |
| Range | 40.8% | 42.0% |
| Mean | 31.1% | 28.5% |
| Median | 31.3% | 27.7% |
| Interquartile 25% (IQ1) | 28.8% | 23.7% |
| Interquartile 75% (IQ3) | 33.8% | 33.4% |
| Interquartile Range (IQR) | 5.0% | 9.7% |
| Standard Deviation (Sample) | 5.9% | 8.3% |
| Standard Deviation (Population) | 5.9% | 8.2% |
Similar Demographics by Family Households with Children
Demographics Similar to Sri Lankans by Family Households with Children
In terms of family households with children, the demographic groups most similar to Sri Lankans are Immigrants from Vietnam (29.5%, a difference of 0.030%), Samoan (29.5%, a difference of 0.18%), Bolivian (29.5%, a difference of 0.19%), Yuman (29.5%, a difference of 0.22%), and Japanese (29.4%, a difference of 0.36%).
| Demographics | Rating | Rank | Family Households with Children |
| Alaska Natives | 100.0 /100 | #19 | Exceptional 29.9% |
| Immigrants | El Salvador | 100.0 /100 | #20 | Exceptional 29.8% |
| Immigrants | Laos | 100.0 /100 | #21 | Exceptional 29.8% |
| Malaysians | 100.0 /100 | #22 | Exceptional 29.8% |
| Mexican American Indians | 100.0 /100 | #23 | Exceptional 29.7% |
| Guamanians/Chamorros | 100.0 /100 | #24 | Exceptional 29.7% |
| Immigrants | Latin America | 100.0 /100 | #25 | Exceptional 29.7% |
| Sri Lankans | 100.0 /100 | #26 | Exceptional 29.5% |
| Immigrants | Vietnam | 100.0 /100 | #27 | Exceptional 29.5% |
| Samoans | 100.0 /100 | #28 | Exceptional 29.5% |
| Bolivians | 100.0 /100 | #29 | Exceptional 29.5% |
| Yuman | 100.0 /100 | #30 | Exceptional 29.5% |
| Japanese | 100.0 /100 | #31 | Exceptional 29.4% |
| Immigrants | Yemen | 100.0 /100 | #32 | Exceptional 29.4% |
| Venezuelans | 100.0 /100 | #33 | Exceptional 29.4% |
Demographics Similar to Immigrants from Costa Rica by Family Households with Children
In terms of family households with children, the demographic groups most similar to Immigrants from Costa Rica are Liberian (28.3%, a difference of 0.010%), Colombian (28.3%, a difference of 0.020%), Immigrants from Western Africa (28.3%, a difference of 0.080%), Immigrants from Thailand (28.2%, a difference of 0.10%), and Immigrants from Liberia (28.2%, a difference of 0.16%).
| Demographics | Rating | Rank | Family Households with Children |
| Kenyans | 99.8 /100 | #82 | Exceptional 28.4% |
| Nicaraguans | 99.8 /100 | #83 | Exceptional 28.4% |
| Costa Ricans | 99.8 /100 | #84 | Exceptional 28.4% |
| Immigrants | Syria | 99.8 /100 | #85 | Exceptional 28.4% |
| Immigrants | Western Africa | 99.6 /100 | #86 | Exceptional 28.3% |
| Colombians | 99.6 /100 | #87 | Exceptional 28.3% |
| Liberians | 99.6 /100 | #88 | Exceptional 28.3% |
| Immigrants | Costa Rica | 99.6 /100 | #89 | Exceptional 28.3% |
| Immigrants | Thailand | 99.5 /100 | #90 | Exceptional 28.2% |
| Immigrants | Liberia | 99.4 /100 | #91 | Exceptional 28.2% |
| Chickasaw | 99.4 /100 | #92 | Exceptional 28.2% |
| Panamanians | 99.3 /100 | #93 | Exceptional 28.2% |
| Immigrants | Colombia | 99.2 /100 | #94 | Exceptional 28.2% |
| Immigrants | Nicaragua | 99.1 /100 | #95 | Exceptional 28.2% |
| Ute | 99.1 /100 | #96 | Exceptional 28.2% |