Sri Lankan vs Arab Family Poverty
COMPARE
Sri Lankan
Arab
Family Poverty
Family Poverty Comparison
Sri Lankans
Arabs
8.5%
FAMILY POVERTY
86.6/ 100
METRIC RATING
133rd/ 347
METRIC RANK
9.2%
FAMILY POVERTY
31.5/ 100
METRIC RATING
190th/ 347
METRIC RANK
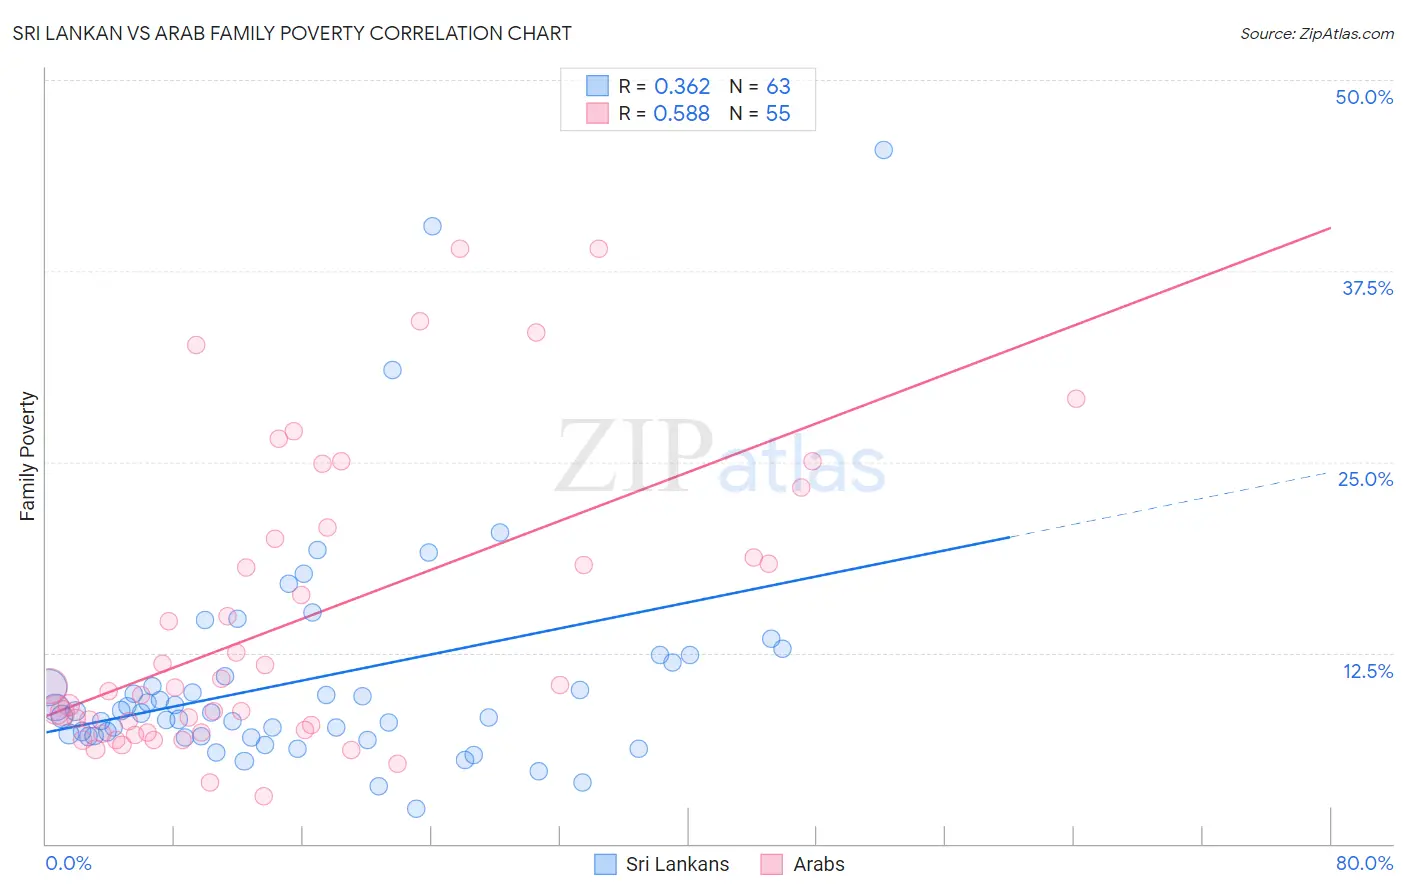
Sri Lankan vs Arab Family Poverty Correlation Chart
The statistical analysis conducted on geographies consisting of 439,246,520 people shows a mild positive correlation between the proportion of Sri Lankans and poverty level among families in the United States with a correlation coefficient (R) of 0.362 and weighted average of 8.5%. Similarly, the statistical analysis conducted on geographies consisting of 484,664,597 people shows a substantial positive correlation between the proportion of Arabs and poverty level among families in the United States with a correlation coefficient (R) of 0.588 and weighted average of 9.2%, a difference of 9.2%.
Family Poverty Correlation Summary
| Measurement | Sri Lankan | Arab |
| Minimum | 2.3% | 3.1% |
| Maximum | 45.5% | 39.0% |
| Range | 43.2% | 35.9% |
| Mean | 10.8% | 14.5% |
| Median | 8.6% | 10.2% |
| Interquartile 25% (IQ1) | 7.0% | 7.3% |
| Interquartile 75% (IQ3) | 11.9% | 19.9% |
| Interquartile Range (IQR) | 4.8% | 12.6% |
| Standard Deviation (Sample) | 7.5% | 9.5% |
| Standard Deviation (Population) | 7.4% | 9.4% |
Similar Demographics by Family Poverty
Demographics Similar to Sri Lankans by Family Poverty
In terms of family poverty, the demographic groups most similar to Sri Lankans are Chilean (8.5%, a difference of 0.010%), Immigrants from Malaysia (8.5%, a difference of 0.050%), Immigrants from Brazil (8.5%, a difference of 0.090%), Immigrants from Southern Europe (8.5%, a difference of 0.17%), and Immigrants from Argentina (8.4%, a difference of 0.50%).
| Demographics | Rating | Rank | Family Poverty |
| Icelanders | 90.3 /100 | #126 | Exceptional 8.3% |
| Immigrants | Hungary | 89.9 /100 | #127 | Excellent 8.4% |
| Argentineans | 89.6 /100 | #128 | Excellent 8.4% |
| Portuguese | 89.2 /100 | #129 | Excellent 8.4% |
| Immigrants | Bosnia and Herzegovina | 88.6 /100 | #130 | Excellent 8.4% |
| Puget Sound Salish | 88.6 /100 | #131 | Excellent 8.4% |
| Immigrants | Argentina | 88.2 /100 | #132 | Excellent 8.4% |
| Sri Lankans | 86.6 /100 | #133 | Excellent 8.5% |
| Chileans | 86.6 /100 | #134 | Excellent 8.5% |
| Immigrants | Malaysia | 86.5 /100 | #135 | Excellent 8.5% |
| Immigrants | Brazil | 86.3 /100 | #136 | Excellent 8.5% |
| Immigrants | Southern Europe | 86.0 /100 | #137 | Excellent 8.5% |
| Armenians | 84.6 /100 | #138 | Excellent 8.5% |
| Immigrants | Nepal | 84.2 /100 | #139 | Excellent 8.5% |
| Immigrants | Kazakhstan | 84.1 /100 | #140 | Excellent 8.5% |
Demographics Similar to Arabs by Family Poverty
In terms of family poverty, the demographic groups most similar to Arabs are Immigrants from Afghanistan (9.2%, a difference of 0.090%), Immigrants from Kenya (9.2%, a difference of 0.37%), Ugandan (9.3%, a difference of 0.41%), Spanish (9.3%, a difference of 0.42%), and Immigrants from Western Asia (9.3%, a difference of 0.50%).
| Demographics | Rating | Rank | Family Poverty |
| Uruguayans | 39.2 /100 | #183 | Fair 9.1% |
| South American Indians | 38.7 /100 | #184 | Fair 9.1% |
| Immigrants | Saudi Arabia | 38.6 /100 | #185 | Fair 9.1% |
| Colombians | 36.1 /100 | #186 | Fair 9.2% |
| Delaware | 35.4 /100 | #187 | Fair 9.2% |
| Immigrants | Kenya | 34.0 /100 | #188 | Fair 9.2% |
| Immigrants | Afghanistan | 32.1 /100 | #189 | Fair 9.2% |
| Arabs | 31.5 /100 | #190 | Fair 9.2% |
| Ugandans | 28.7 /100 | #191 | Fair 9.3% |
| Spanish | 28.7 /100 | #192 | Fair 9.3% |
| Immigrants | Western Asia | 28.2 /100 | #193 | Fair 9.3% |
| South Americans | 28.1 /100 | #194 | Fair 9.3% |
| Venezuelans | 27.4 /100 | #195 | Fair 9.3% |
| Immigrants | Venezuela | 26.1 /100 | #196 | Fair 9.3% |
| Immigrants | Colombia | 24.4 /100 | #197 | Fair 9.3% |