Sri Lankan vs Arab Female Unemployment
COMPARE
Sri Lankan
Arab
Female Unemployment
Female Unemployment Comparison
Sri Lankans
Arabs
5.2%
FEMALE UNEMPLOYMENT
59.4/ 100
METRIC RATING
168th/ 347
METRIC RANK
5.3%
FEMALE UNEMPLOYMENT
27.7/ 100
METRIC RATING
193rd/ 347
METRIC RANK
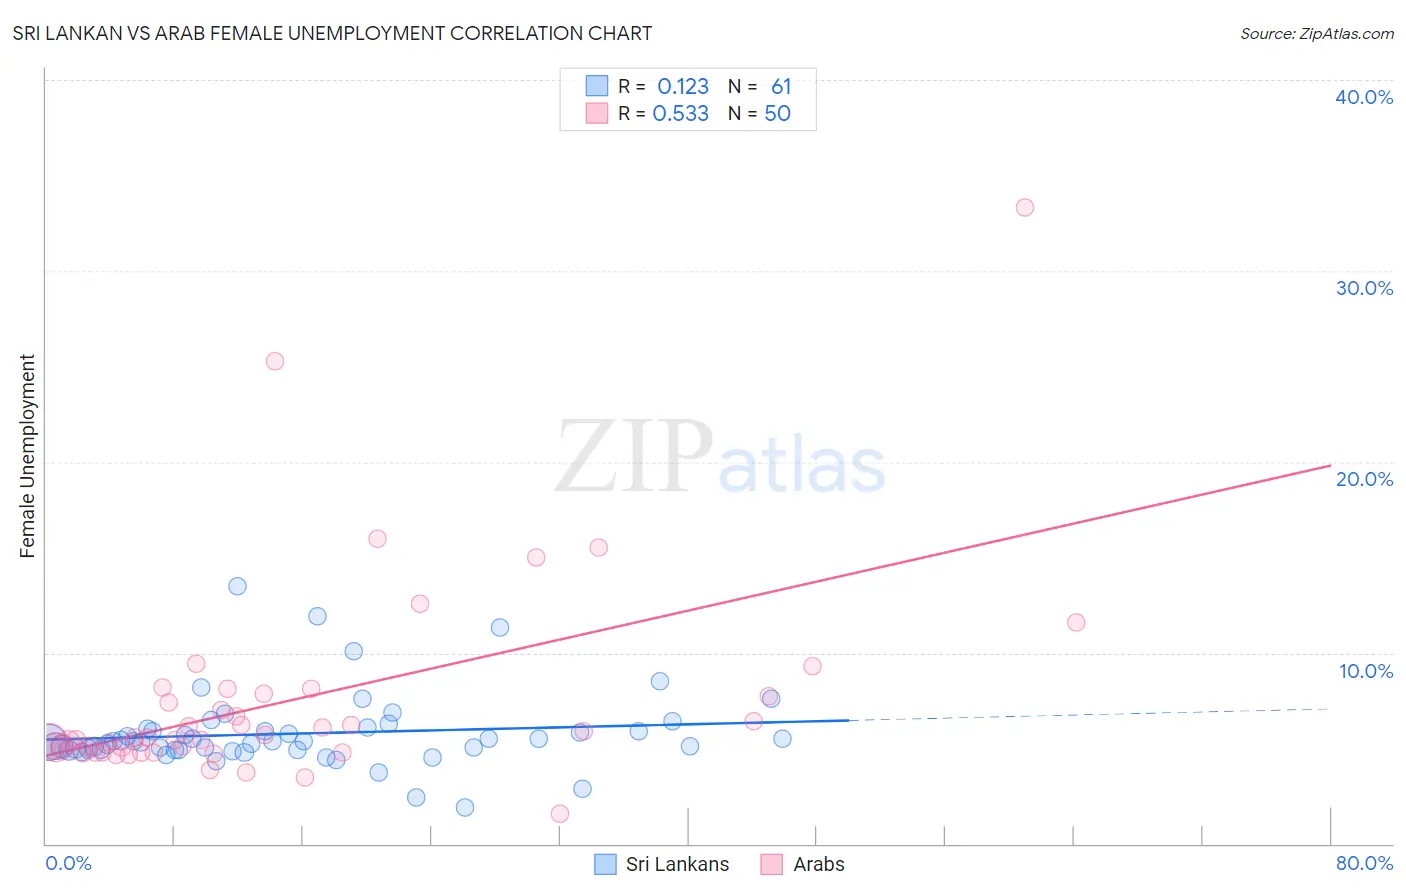
Sri Lankan vs Arab Female Unemployment Correlation Chart
The statistical analysis conducted on geographies consisting of 438,500,315 people shows a poor positive correlation between the proportion of Sri Lankans and unemploymnet rate among females in the United States with a correlation coefficient (R) of 0.123 and weighted average of 5.2%. Similarly, the statistical analysis conducted on geographies consisting of 483,183,943 people shows a substantial positive correlation between the proportion of Arabs and unemploymnet rate among females in the United States with a correlation coefficient (R) of 0.533 and weighted average of 5.3%, a difference of 2.0%.
Female Unemployment Correlation Summary
| Measurement | Sri Lankan | Arab |
| Minimum | 1.9% | 1.6% |
| Maximum | 13.5% | 33.3% |
| Range | 11.6% | 31.7% |
| Mean | 5.8% | 7.5% |
| Median | 5.3% | 5.6% |
| Interquartile 25% (IQ1) | 4.9% | 4.8% |
| Interquartile 75% (IQ3) | 6.0% | 7.8% |
| Interquartile Range (IQR) | 1.1% | 3.0% |
| Standard Deviation (Sample) | 2.0% | 5.4% |
| Standard Deviation (Population) | 1.9% | 5.4% |
Similar Demographics by Female Unemployment
Demographics Similar to Sri Lankans by Female Unemployment
In terms of female unemployment, the demographic groups most similar to Sri Lankans are Immigrants from Chile (5.2%, a difference of 0.030%), Immigrants from Thailand (5.2%, a difference of 0.17%), Syrian (5.2%, a difference of 0.21%), Native Hawaiian (5.2%, a difference of 0.21%), and Spanish (5.2%, a difference of 0.22%).
| Demographics | Rating | Rank | Female Unemployment |
| Immigrants | Pakistan | 66.7 /100 | #161 | Good 5.2% |
| Potawatomi | 65.9 /100 | #162 | Good 5.2% |
| Immigrants | Asia | 64.3 /100 | #163 | Good 5.2% |
| Bangladeshis | 64.3 /100 | #164 | Good 5.2% |
| Syrians | 62.8 /100 | #165 | Good 5.2% |
| Native Hawaiians | 62.7 /100 | #166 | Good 5.2% |
| Immigrants | Thailand | 62.1 /100 | #167 | Good 5.2% |
| Sri Lankans | 59.4 /100 | #168 | Average 5.2% |
| Immigrants | Chile | 59.0 /100 | #169 | Average 5.2% |
| Spanish | 55.9 /100 | #170 | Average 5.2% |
| Immigrants | Denmark | 55.0 /100 | #171 | Average 5.2% |
| Immigrants | Uganda | 50.7 /100 | #172 | Average 5.3% |
| Iranians | 50.4 /100 | #173 | Average 5.3% |
| Immigrants | Poland | 50.0 /100 | #174 | Average 5.3% |
| Immigrants | Laos | 47.5 /100 | #175 | Average 5.3% |
Demographics Similar to Arabs by Female Unemployment
In terms of female unemployment, the demographic groups most similar to Arabs are Colombian (5.3%, a difference of 0.050%), Portuguese (5.3%, a difference of 0.070%), Immigrants from Colombia (5.3%, a difference of 0.11%), Spaniard (5.3%, a difference of 0.19%), and Cherokee (5.3%, a difference of 0.23%).
| Demographics | Rating | Rank | Female Unemployment |
| Immigrants | Belarus | 39.4 /100 | #186 | Fair 5.3% |
| Immigrants | Albania | 35.4 /100 | #187 | Fair 5.3% |
| Afghans | 33.9 /100 | #188 | Fair 5.3% |
| Costa Ricans | 33.8 /100 | #189 | Fair 5.3% |
| Ugandans | 31.2 /100 | #190 | Fair 5.3% |
| Cherokee | 30.8 /100 | #191 | Fair 5.3% |
| Portuguese | 28.6 /100 | #192 | Fair 5.3% |
| Arabs | 27.7 /100 | #193 | Fair 5.3% |
| Colombians | 27.0 /100 | #194 | Fair 5.3% |
| Immigrants | Colombia | 26.2 /100 | #195 | Fair 5.3% |
| Spaniards | 25.2 /100 | #196 | Fair 5.3% |
| Alsatians | 23.9 /100 | #197 | Fair 5.3% |
| Tsimshian | 23.1 /100 | #198 | Fair 5.4% |
| Hawaiians | 22.2 /100 | #199 | Fair 5.4% |
| Soviet Union | 21.7 /100 | #200 | Fair 5.4% |