Sri Lankan vs Cajun Family Poverty
COMPARE
Sri Lankan
Cajun
Family Poverty
Family Poverty Comparison
Sri Lankans
Cajuns
8.5%
FAMILY POVERTY
86.6/ 100
METRIC RATING
133rd/ 347
METRIC RANK
11.9%
FAMILY POVERTY
0.0/ 100
METRIC RATING
306th/ 347
METRIC RANK
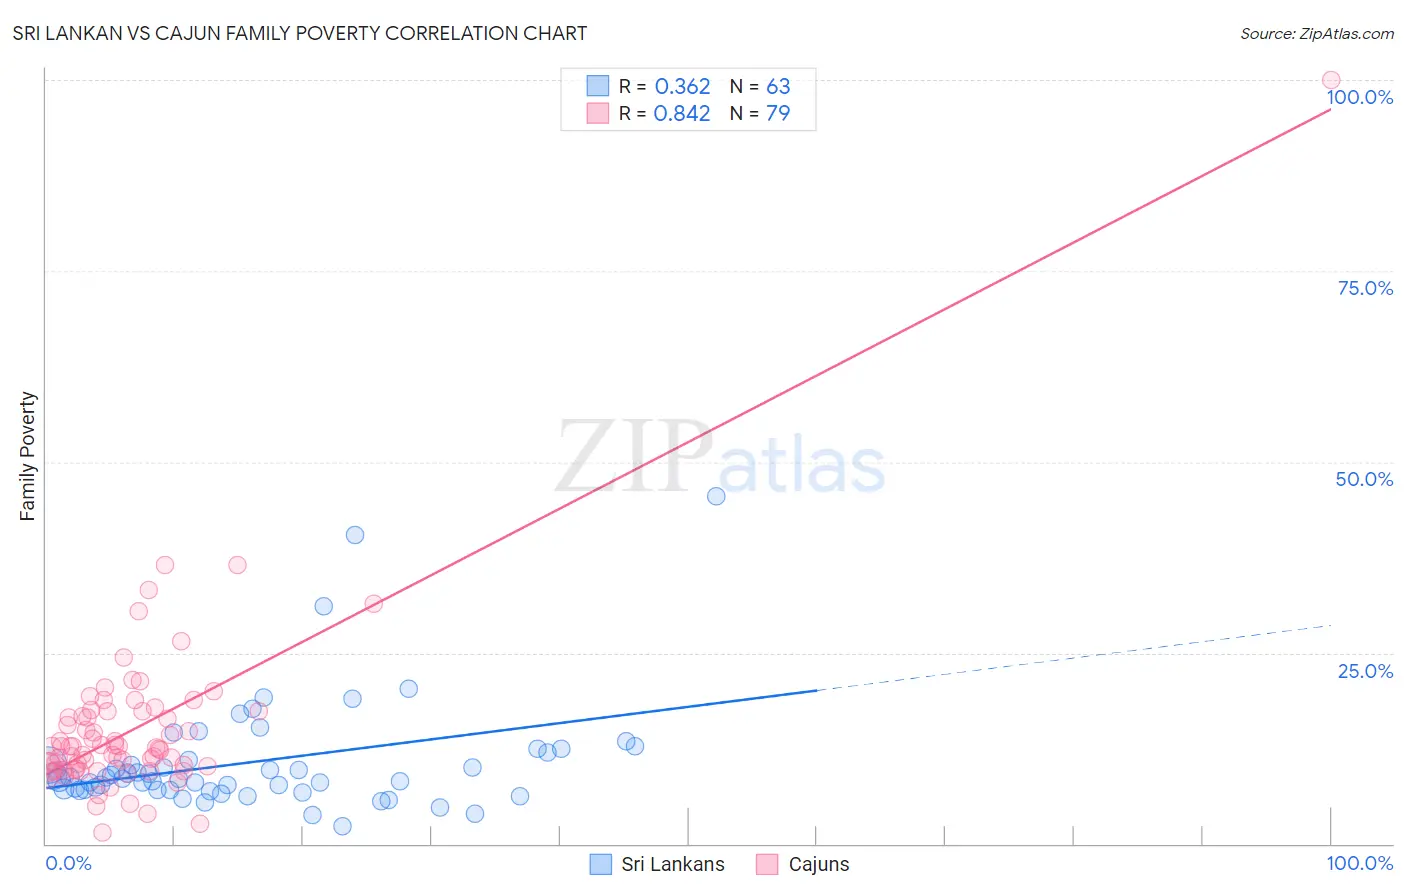
Sri Lankan vs Cajun Family Poverty Correlation Chart
The statistical analysis conducted on geographies consisting of 439,246,520 people shows a mild positive correlation between the proportion of Sri Lankans and poverty level among families in the United States with a correlation coefficient (R) of 0.362 and weighted average of 8.5%. Similarly, the statistical analysis conducted on geographies consisting of 149,591,536 people shows a very strong positive correlation between the proportion of Cajuns and poverty level among families in the United States with a correlation coefficient (R) of 0.842 and weighted average of 11.9%, a difference of 40.5%.
Family Poverty Correlation Summary
| Measurement | Sri Lankan | Cajun |
| Minimum | 2.3% | 1.5% |
| Maximum | 45.5% | 100.0% |
| Range | 43.2% | 98.5% |
| Mean | 10.8% | 15.2% |
| Median | 8.6% | 12.7% |
| Interquartile 25% (IQ1) | 7.0% | 9.9% |
| Interquartile 75% (IQ3) | 11.9% | 17.4% |
| Interquartile Range (IQR) | 4.8% | 7.5% |
| Standard Deviation (Sample) | 7.5% | 11.9% |
| Standard Deviation (Population) | 7.4% | 11.8% |
Similar Demographics by Family Poverty
Demographics Similar to Sri Lankans by Family Poverty
In terms of family poverty, the demographic groups most similar to Sri Lankans are Chilean (8.5%, a difference of 0.010%), Immigrants from Malaysia (8.5%, a difference of 0.050%), Immigrants from Brazil (8.5%, a difference of 0.090%), Immigrants from Southern Europe (8.5%, a difference of 0.17%), and Immigrants from Argentina (8.4%, a difference of 0.50%).
| Demographics | Rating | Rank | Family Poverty |
| Icelanders | 90.3 /100 | #126 | Exceptional 8.3% |
| Immigrants | Hungary | 89.9 /100 | #127 | Excellent 8.4% |
| Argentineans | 89.6 /100 | #128 | Excellent 8.4% |
| Portuguese | 89.2 /100 | #129 | Excellent 8.4% |
| Immigrants | Bosnia and Herzegovina | 88.6 /100 | #130 | Excellent 8.4% |
| Puget Sound Salish | 88.6 /100 | #131 | Excellent 8.4% |
| Immigrants | Argentina | 88.2 /100 | #132 | Excellent 8.4% |
| Sri Lankans | 86.6 /100 | #133 | Excellent 8.5% |
| Chileans | 86.6 /100 | #134 | Excellent 8.5% |
| Immigrants | Malaysia | 86.5 /100 | #135 | Excellent 8.5% |
| Immigrants | Brazil | 86.3 /100 | #136 | Excellent 8.5% |
| Immigrants | Southern Europe | 86.0 /100 | #137 | Excellent 8.5% |
| Armenians | 84.6 /100 | #138 | Excellent 8.5% |
| Immigrants | Nepal | 84.2 /100 | #139 | Excellent 8.5% |
| Immigrants | Kazakhstan | 84.1 /100 | #140 | Excellent 8.5% |
Demographics Similar to Cajuns by Family Poverty
In terms of family poverty, the demographic groups most similar to Cajuns are Immigrants from Congo (11.9%, a difference of 0.11%), Seminole (11.9%, a difference of 0.17%), Mexican (11.8%, a difference of 0.56%), Hispanic or Latino (12.0%, a difference of 0.61%), and Immigrants from Guatemala (12.0%, a difference of 0.62%).
| Demographics | Rating | Rank | Family Poverty |
| Dutch West Indians | 0.0 /100 | #299 | Tragic 11.7% |
| Immigrants | Bangladesh | 0.0 /100 | #300 | Tragic 11.7% |
| Bahamians | 0.0 /100 | #301 | Tragic 11.7% |
| Guatemalans | 0.0 /100 | #302 | Tragic 11.7% |
| Africans | 0.0 /100 | #303 | Tragic 11.8% |
| Immigrants | Latin America | 0.0 /100 | #304 | Tragic 11.8% |
| Mexicans | 0.0 /100 | #305 | Tragic 11.8% |
| Cajuns | 0.0 /100 | #306 | Tragic 11.9% |
| Immigrants | Congo | 0.0 /100 | #307 | Tragic 11.9% |
| Seminole | 0.0 /100 | #308 | Tragic 11.9% |
| Hispanics or Latinos | 0.0 /100 | #309 | Tragic 12.0% |
| Immigrants | Guatemala | 0.0 /100 | #310 | Tragic 12.0% |
| Ute | 0.0 /100 | #311 | Tragic 12.1% |
| Immigrants | Central America | 0.0 /100 | #312 | Tragic 12.1% |
| Immigrants | Caribbean | 0.0 /100 | #313 | Tragic 12.2% |