Sri Lankan vs Arab Nursery School
COMPARE
Sri Lankan
Arab
Nursery School
Nursery School Comparison
Sri Lankans
Arabs
97.0%
NURSERY SCHOOL
0.0/ 100
METRIC RATING
312th/ 347
METRIC RANK
97.9%
NURSERY SCHOOL
34.7/ 100
METRIC RATING
188th/ 347
METRIC RANK
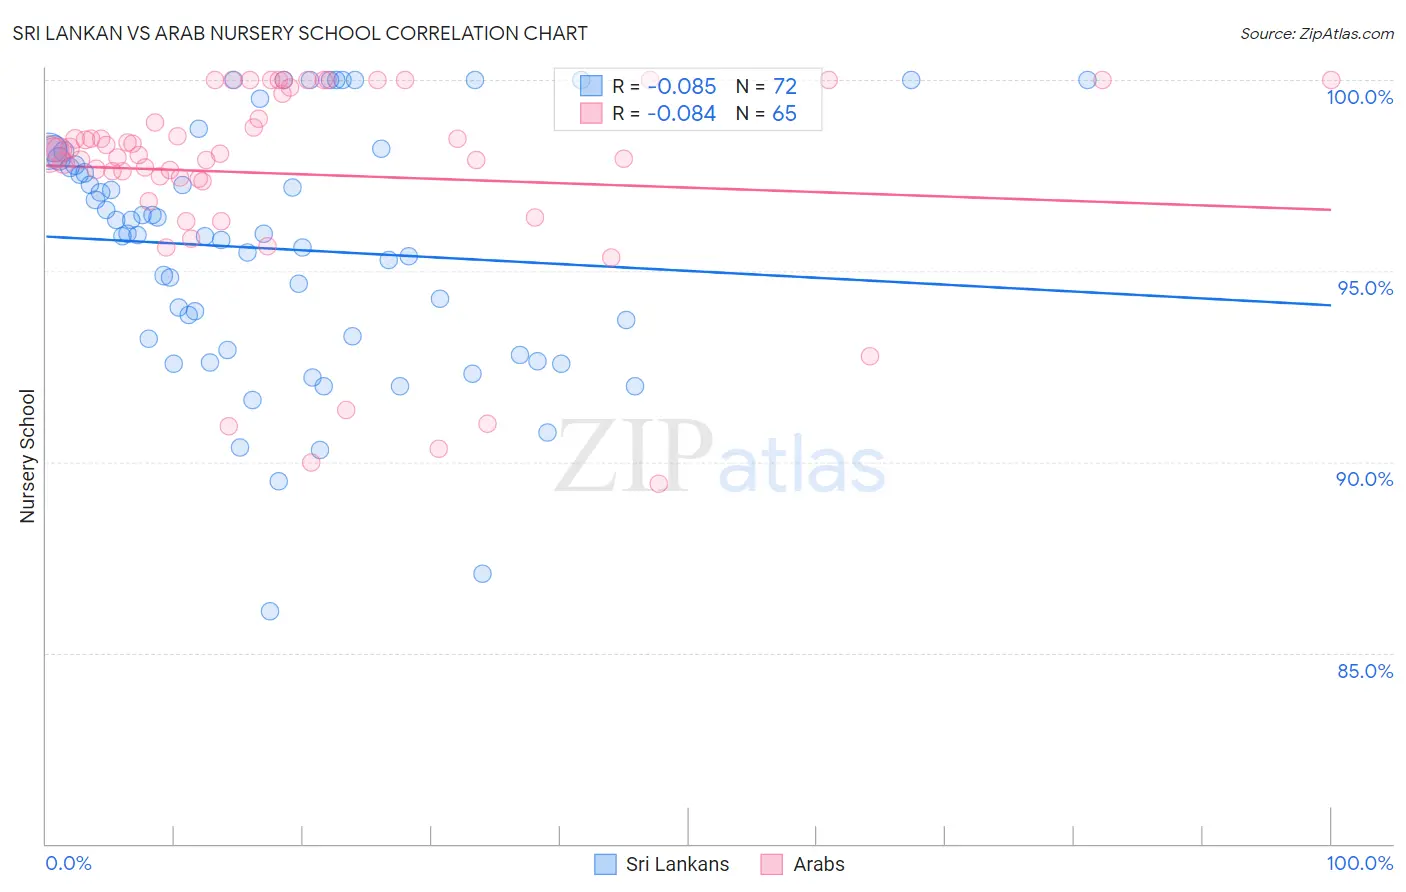
Sri Lankan vs Arab Nursery School Correlation Chart
The statistical analysis conducted on geographies consisting of 440,593,746 people shows a slight negative correlation between the proportion of Sri Lankans and percentage of population with at least nursery school education in the United States with a correlation coefficient (R) of -0.085 and weighted average of 97.0%. Similarly, the statistical analysis conducted on geographies consisting of 486,872,066 people shows a slight negative correlation between the proportion of Arabs and percentage of population with at least nursery school education in the United States with a correlation coefficient (R) of -0.084 and weighted average of 97.9%, a difference of 0.98%.
Nursery School Correlation Summary
| Measurement | Sri Lankan | Arab |
| Minimum | 86.1% | 89.4% |
| Maximum | 100.0% | 100.0% |
| Range | 13.9% | 10.6% |
| Mean | 95.6% | 97.5% |
| Median | 96.0% | 98.1% |
| Interquartile 25% (IQ1) | 93.1% | 97.4% |
| Interquartile 75% (IQ3) | 97.8% | 99.7% |
| Interquartile Range (IQR) | 4.8% | 2.3% |
| Standard Deviation (Sample) | 3.2% | 2.7% |
| Standard Deviation (Population) | 3.2% | 2.7% |
Similar Demographics by Nursery School
Demographics Similar to Sri Lankans by Nursery School
In terms of nursery school, the demographic groups most similar to Sri Lankans are Guyanese (97.0%, a difference of 0.0%), Immigrants from the Azores (97.0%, a difference of 0.0%), Immigrants from Somalia (97.0%, a difference of 0.010%), Honduran (97.0%, a difference of 0.020%), and Hispanic or Latino (97.0%, a difference of 0.030%).
| Demographics | Rating | Rank | Nursery School |
| Somalis | 0.0 /100 | #305 | Tragic 97.1% |
| Belizeans | 0.0 /100 | #306 | Tragic 97.0% |
| Hispanics or Latinos | 0.0 /100 | #307 | Tragic 97.0% |
| Immigrants | Haiti | 0.0 /100 | #308 | Tragic 97.0% |
| Immigrants | Somalia | 0.0 /100 | #309 | Tragic 97.0% |
| Guyanese | 0.0 /100 | #310 | Tragic 97.0% |
| Immigrants | Azores | 0.0 /100 | #311 | Tragic 97.0% |
| Sri Lankans | 0.0 /100 | #312 | Tragic 97.0% |
| Hondurans | 0.0 /100 | #313 | Tragic 97.0% |
| Cape Verdeans | 0.0 /100 | #314 | Tragic 97.0% |
| Immigrants | Nicaragua | 0.0 /100 | #315 | Tragic 96.9% |
| Immigrants | Belize | 0.0 /100 | #316 | Tragic 96.9% |
| Immigrants | Ecuador | 0.0 /100 | #317 | Tragic 96.9% |
| Immigrants | Guyana | 0.0 /100 | #318 | Tragic 96.9% |
| Immigrants | Laos | 0.0 /100 | #319 | Tragic 96.9% |
Demographics Similar to Arabs by Nursery School
In terms of nursery school, the demographic groups most similar to Arabs are Pakistani (97.9%, a difference of 0.0%), Panamanian (97.9%, a difference of 0.0%), Immigrants from Kazakhstan (97.9%, a difference of 0.010%), Immigrants from Taiwan (97.9%, a difference of 0.010%), and Paiute (98.0%, a difference of 0.020%).
| Demographics | Rating | Rank | Nursery School |
| Egyptians | 42.8 /100 | #181 | Average 98.0% |
| Paiute | 42.0 /100 | #182 | Average 98.0% |
| Portuguese | 41.8 /100 | #183 | Average 98.0% |
| Immigrants | Poland | 41.3 /100 | #184 | Average 98.0% |
| Immigrants | Belarus | 41.0 /100 | #185 | Average 98.0% |
| Immigrants | Argentina | 40.8 /100 | #186 | Average 98.0% |
| Immigrants | Kazakhstan | 37.1 /100 | #187 | Fair 97.9% |
| Arabs | 34.7 /100 | #188 | Fair 97.9% |
| Pakistanis | 34.6 /100 | #189 | Fair 97.9% |
| Panamanians | 34.3 /100 | #190 | Fair 97.9% |
| Immigrants | Taiwan | 30.6 /100 | #191 | Fair 97.9% |
| Blacks/African Americans | 29.4 /100 | #192 | Fair 97.9% |
| Paraguayans | 27.4 /100 | #193 | Fair 97.9% |
| Mongolians | 27.3 /100 | #194 | Fair 97.9% |
| Hawaiians | 27.2 /100 | #195 | Fair 97.9% |