Spanish vs Marshallese Nursery School
COMPARE
Spanish
Marshallese
Nursery School
Nursery School Comparison
Spanish
Marshallese
98.2%
NURSERY SCHOOL
95.8/ 100
METRIC RATING
116th/ 347
METRIC RANK
98.1%
NURSERY SCHOOL
81.2/ 100
METRIC RATING
143rd/ 347
METRIC RANK
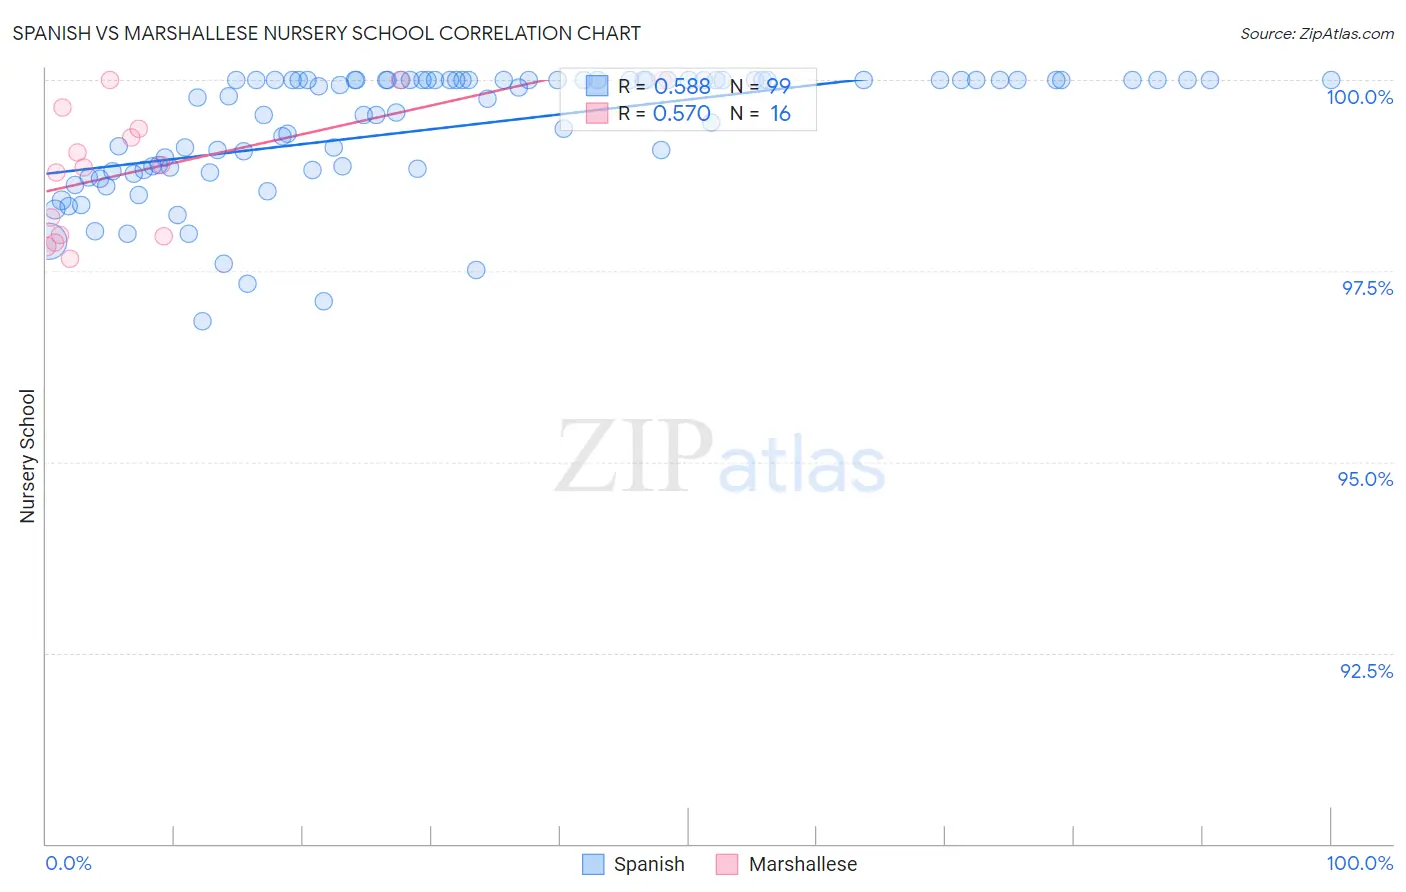
Spanish vs Marshallese Nursery School Correlation Chart
The statistical analysis conducted on geographies consisting of 422,189,210 people shows a substantial positive correlation between the proportion of Spanish and percentage of population with at least nursery school education in the United States with a correlation coefficient (R) of 0.588 and weighted average of 98.2%. Similarly, the statistical analysis conducted on geographies consisting of 14,761,315 people shows a substantial positive correlation between the proportion of Marshallese and percentage of population with at least nursery school education in the United States with a correlation coefficient (R) of 0.570 and weighted average of 98.1%, a difference of 0.12%.
Nursery School Correlation Summary
| Measurement | Spanish | Marshallese |
| Minimum | 96.8% | 97.7% |
| Maximum | 100.0% | 100.0% |
| Range | 3.2% | 2.3% |
| Mean | 99.4% | 98.8% |
| Median | 99.9% | 98.9% |
| Interquartile 25% (IQ1) | 98.8% | 98.0% |
| Interquartile 75% (IQ3) | 100.0% | 99.5% |
| Interquartile Range (IQR) | 1.2% | 1.5% |
| Standard Deviation (Sample) | 0.80% | 0.84% |
| Standard Deviation (Population) | 0.80% | 0.81% |
Similar Demographics by Nursery School
Demographics Similar to Spanish by Nursery School
In terms of nursery school, the demographic groups most similar to Spanish are Immigrants from France (98.2%, a difference of 0.0%), Immigrants from Latvia (98.2%, a difference of 0.010%), Ute (98.2%, a difference of 0.010%), Iranian (98.2%, a difference of 0.010%), and Yugoslavian (98.2%, a difference of 0.010%).
| Demographics | Rating | Rank | Nursery School |
| German Russians | 97.1 /100 | #109 | Exceptional 98.2% |
| Immigrants | Singapore | 96.9 /100 | #110 | Exceptional 98.2% |
| Immigrants | Czechoslovakia | 96.8 /100 | #111 | Exceptional 98.2% |
| Immigrants | Norway | 96.6 /100 | #112 | Exceptional 98.2% |
| Immigrants | Latvia | 96.4 /100 | #113 | Exceptional 98.2% |
| Ute | 96.4 /100 | #114 | Exceptional 98.2% |
| Iranians | 96.3 /100 | #115 | Exceptional 98.2% |
| Spanish | 95.8 /100 | #116 | Exceptional 98.2% |
| Immigrants | France | 95.6 /100 | #117 | Exceptional 98.2% |
| Yugoslavians | 95.4 /100 | #118 | Exceptional 98.2% |
| Thais | 95.0 /100 | #119 | Exceptional 98.2% |
| Okinawans | 94.5 /100 | #120 | Exceptional 98.2% |
| Immigrants | Zimbabwe | 94.2 /100 | #121 | Exceptional 98.2% |
| Immigrants | Japan | 94.0 /100 | #122 | Exceptional 98.2% |
| Syrians | 93.9 /100 | #123 | Exceptional 98.2% |
Demographics Similar to Marshallese by Nursery School
In terms of nursery school, the demographic groups most similar to Marshallese are Burmese (98.1%, a difference of 0.0%), Alsatian (98.1%, a difference of 0.0%), Palestinian (98.1%, a difference of 0.010%), Immigrants from Turkey (98.1%, a difference of 0.010%), and Immigrants from Israel (98.1%, a difference of 0.010%).
| Demographics | Rating | Rank | Nursery School |
| Immigrants | Kuwait | 88.9 /100 | #136 | Excellent 98.1% |
| Israelis | 88.2 /100 | #137 | Excellent 98.1% |
| Immigrants | Romania | 88.0 /100 | #138 | Excellent 98.1% |
| Blackfeet | 87.5 /100 | #139 | Excellent 98.1% |
| Palestinians | 83.7 /100 | #140 | Excellent 98.1% |
| Immigrants | Turkey | 83.0 /100 | #141 | Excellent 98.1% |
| Burmese | 81.7 /100 | #142 | Excellent 98.1% |
| Marshallese | 81.2 /100 | #143 | Excellent 98.1% |
| Alsatians | 80.3 /100 | #144 | Excellent 98.1% |
| Immigrants | Israel | 78.5 /100 | #145 | Good 98.1% |
| Filipinos | 78.5 /100 | #146 | Good 98.1% |
| Hmong | 75.7 /100 | #147 | Good 98.1% |
| Immigrants | Greece | 75.4 /100 | #148 | Good 98.1% |
| Apache | 73.2 /100 | #149 | Good 98.1% |
| Jordanians | 72.9 /100 | #150 | Good 98.1% |