Spanish American vs Immigrants from Lebanon Poverty
COMPARE
Spanish American
Immigrants from Lebanon
Poverty
Poverty Comparison
Spanish Americans
Immigrants from Lebanon
14.7%
POVERTY
0.0/ 100
METRIC RATING
273rd/ 347
METRIC RANK
12.8%
POVERTY
18.7/ 100
METRIC RATING
197th/ 347
METRIC RANK
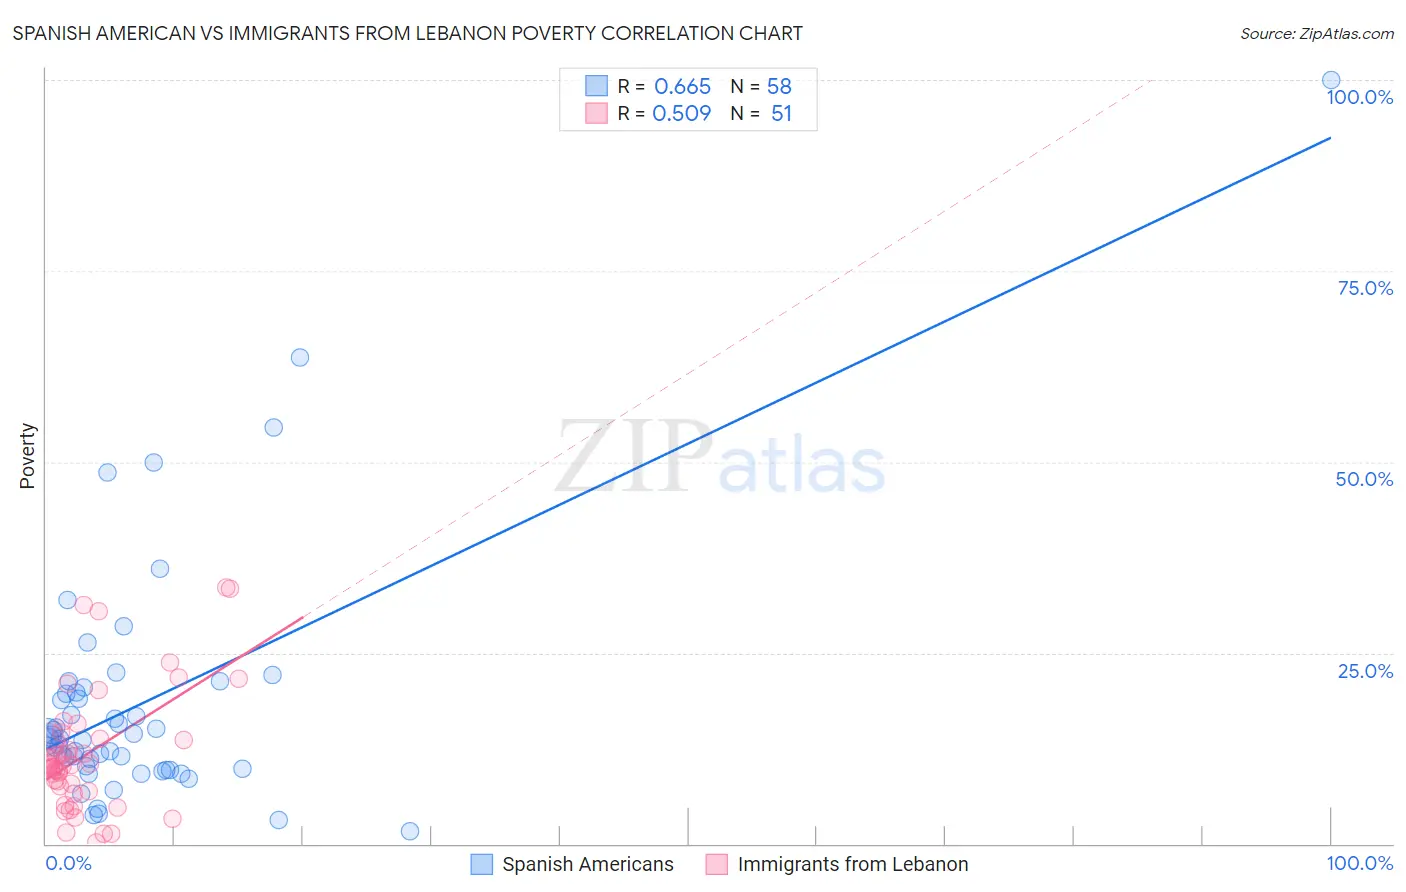
Spanish American vs Immigrants from Lebanon Poverty Correlation Chart
The statistical analysis conducted on geographies consisting of 103,164,738 people shows a significant positive correlation between the proportion of Spanish Americans and poverty level in the United States with a correlation coefficient (R) of 0.665 and weighted average of 14.7%. Similarly, the statistical analysis conducted on geographies consisting of 217,129,888 people shows a substantial positive correlation between the proportion of Immigrants from Lebanon and poverty level in the United States with a correlation coefficient (R) of 0.509 and weighted average of 12.8%, a difference of 15.6%.
Poverty Correlation Summary
| Measurement | Spanish American | Immigrants from Lebanon |
| Minimum | 1.6% | 0.24% |
| Maximum | 100.0% | 33.6% |
| Range | 98.4% | 33.4% |
| Mean | 18.4% | 11.8% |
| Median | 13.8% | 10.2% |
| Interquartile 25% (IQ1) | 9.8% | 6.9% |
| Interquartile 75% (IQ3) | 19.8% | 13.7% |
| Interquartile Range (IQR) | 10.0% | 6.8% |
| Standard Deviation (Sample) | 16.4% | 8.0% |
| Standard Deviation (Population) | 16.3% | 7.9% |
Similar Demographics by Poverty
Demographics Similar to Spanish Americans by Poverty
In terms of poverty, the demographic groups most similar to Spanish Americans are Barbadian (14.8%, a difference of 0.39%), Immigrants from West Indies (14.8%, a difference of 0.43%), Immigrants from Bahamas (14.8%, a difference of 0.43%), Bangladeshi (14.8%, a difference of 0.48%), and Belizean (14.8%, a difference of 0.50%).
| Demographics | Rating | Rank | Poverty |
| Guyanese | 0.1 /100 | #266 | Tragic 14.5% |
| Iroquois | 0.1 /100 | #267 | Tragic 14.5% |
| Sub-Saharan Africans | 0.1 /100 | #268 | Tragic 14.5% |
| Immigrants | Cuba | 0.1 /100 | #269 | Tragic 14.6% |
| Central Americans | 0.1 /100 | #270 | Tragic 14.6% |
| Shoshone | 0.0 /100 | #271 | Tragic 14.7% |
| Chickasaw | 0.0 /100 | #272 | Tragic 14.7% |
| Spanish Americans | 0.0 /100 | #273 | Tragic 14.7% |
| Barbadians | 0.0 /100 | #274 | Tragic 14.8% |
| Immigrants | West Indies | 0.0 /100 | #275 | Tragic 14.8% |
| Immigrants | Bahamas | 0.0 /100 | #276 | Tragic 14.8% |
| Bangladeshis | 0.0 /100 | #277 | Tragic 14.8% |
| Belizeans | 0.0 /100 | #278 | Tragic 14.8% |
| Immigrants | St. Vincent and the Grenadines | 0.0 /100 | #279 | Tragic 14.9% |
| Haitians | 0.0 /100 | #280 | Tragic 14.9% |
Demographics Similar to Immigrants from Lebanon by Poverty
In terms of poverty, the demographic groups most similar to Immigrants from Lebanon are Spanish (12.8%, a difference of 0.010%), Immigrants from Kenya (12.8%, a difference of 0.20%), Iraqi (12.7%, a difference of 0.31%), Immigrants from Kuwait (12.7%, a difference of 0.32%), and Spaniard (12.8%, a difference of 0.35%).
| Demographics | Rating | Rank | Poverty |
| Immigrants | South America | 32.3 /100 | #190 | Fair 12.5% |
| Sierra Leoneans | 31.5 /100 | #191 | Fair 12.6% |
| South American Indians | 23.3 /100 | #192 | Fair 12.7% |
| Delaware | 21.4 /100 | #193 | Fair 12.7% |
| Arabs | 21.1 /100 | #194 | Fair 12.7% |
| Immigrants | Kuwait | 20.9 /100 | #195 | Fair 12.7% |
| Iraqis | 20.8 /100 | #196 | Fair 12.7% |
| Immigrants | Lebanon | 18.7 /100 | #197 | Poor 12.8% |
| Spanish | 18.7 /100 | #198 | Poor 12.8% |
| Immigrants | Kenya | 17.5 /100 | #199 | Poor 12.8% |
| Spaniards | 16.5 /100 | #200 | Poor 12.8% |
| Immigrants | Uganda | 16.5 /100 | #201 | Poor 12.8% |
| Immigrants | Uruguay | 15.6 /100 | #202 | Poor 12.8% |
| Hmong | 15.0 /100 | #203 | Poor 12.8% |
| Immigrants | Western Asia | 14.1 /100 | #204 | Poor 12.9% |