Spanish American vs Immigrants from Lebanon Seniors Poverty Over the Age of 75
COMPARE
Spanish American
Immigrants from Lebanon
Seniors Poverty Over the Age of 75
Seniors Poverty Over the Age of 75 Comparison
Spanish Americans
Immigrants from Lebanon
13.5%
SENIORS POVERTY OVER THE AGE OF 75
0.5/ 100
METRIC RATING
244th/ 347
METRIC RANK
12.7%
SENIORS POVERTY OVER THE AGE OF 75
12.7/ 100
METRIC RATING
199th/ 347
METRIC RANK
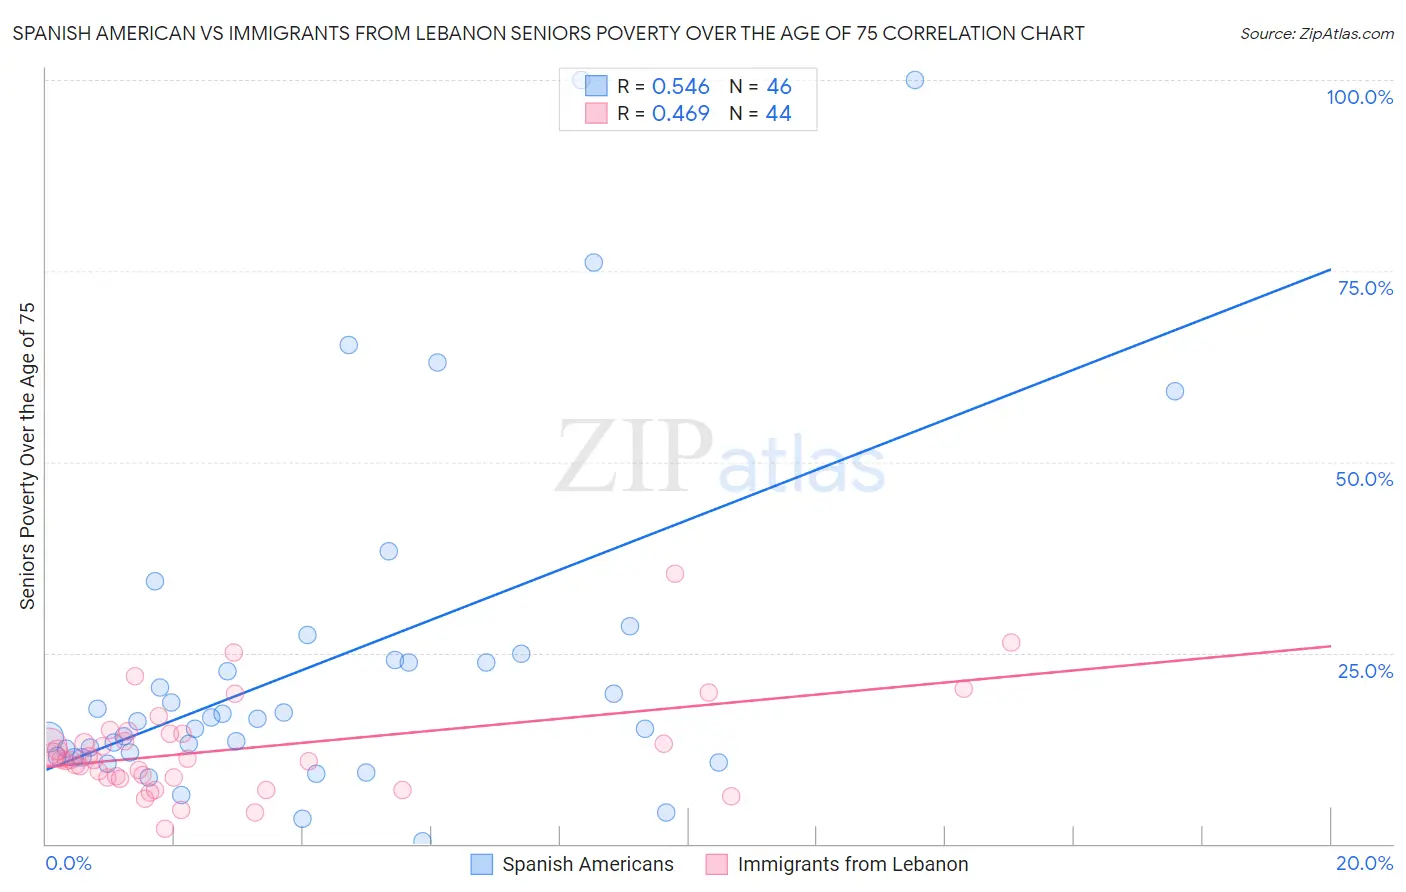
Spanish American vs Immigrants from Lebanon Seniors Poverty Over the Age of 75 Correlation Chart
The statistical analysis conducted on geographies consisting of 102,922,001 people shows a substantial positive correlation between the proportion of Spanish Americans and poverty level among seniors over the age of 75 in the United States with a correlation coefficient (R) of 0.546 and weighted average of 13.5%. Similarly, the statistical analysis conducted on geographies consisting of 215,969,018 people shows a moderate positive correlation between the proportion of Immigrants from Lebanon and poverty level among seniors over the age of 75 in the United States with a correlation coefficient (R) of 0.469 and weighted average of 12.7%, a difference of 6.6%.
Seniors Poverty Over the Age of 75 Correlation Summary
| Measurement | Spanish American | Immigrants from Lebanon |
| Minimum | 0.28% | 2.0% |
| Maximum | 100.0% | 35.3% |
| Range | 99.7% | 33.3% |
| Mean | 24.0% | 12.4% |
| Median | 16.2% | 11.0% |
| Interquartile 25% (IQ1) | 11.5% | 8.7% |
| Interquartile 75% (IQ3) | 24.1% | 14.4% |
| Interquartile Range (IQR) | 12.6% | 5.7% |
| Standard Deviation (Sample) | 23.0% | 6.3% |
| Standard Deviation (Population) | 22.7% | 6.3% |
Similar Demographics by Seniors Poverty Over the Age of 75
Demographics Similar to Spanish Americans by Seniors Poverty Over the Age of 75
In terms of seniors poverty over the age of 75, the demographic groups most similar to Spanish Americans are Uruguayan (13.5%, a difference of 0.14%), Dutch West Indian (13.5%, a difference of 0.32%), Immigrants from Somalia (13.5%, a difference of 0.34%), Immigrants from Cambodia (13.6%, a difference of 0.37%), and Immigrants from Russia (13.4%, a difference of 0.44%).
| Demographics | Rating | Rank | Seniors Poverty Over the Age of 75 |
| Alaskan Athabascans | 0.8 /100 | #237 | Tragic 13.4% |
| Peruvians | 0.8 /100 | #238 | Tragic 13.4% |
| Panamanians | 0.8 /100 | #239 | Tragic 13.4% |
| Argentineans | 0.7 /100 | #240 | Tragic 13.4% |
| Immigrants | Russia | 0.6 /100 | #241 | Tragic 13.4% |
| Immigrants | Somalia | 0.6 /100 | #242 | Tragic 13.5% |
| Dutch West Indians | 0.6 /100 | #243 | Tragic 13.5% |
| Spanish Americans | 0.5 /100 | #244 | Tragic 13.5% |
| Uruguayans | 0.5 /100 | #245 | Tragic 13.5% |
| Immigrants | Cambodia | 0.4 /100 | #246 | Tragic 13.6% |
| Immigrants | Ukraine | 0.3 /100 | #247 | Tragic 13.6% |
| Africans | 0.3 /100 | #248 | Tragic 13.6% |
| Immigrants | Albania | 0.3 /100 | #249 | Tragic 13.6% |
| Mexican American Indians | 0.3 /100 | #250 | Tragic 13.6% |
| Immigrants | Peru | 0.3 /100 | #251 | Tragic 13.7% |
Demographics Similar to Immigrants from Lebanon by Seniors Poverty Over the Age of 75
In terms of seniors poverty over the age of 75, the demographic groups most similar to Immigrants from Lebanon are Immigrants from Vietnam (12.7%, a difference of 0.10%), Chilean (12.6%, a difference of 0.17%), Nepalese (12.6%, a difference of 0.28%), Paraguayan (12.7%, a difference of 0.30%), and Arapaho (12.7%, a difference of 0.33%).
| Demographics | Rating | Rank | Seniors Poverty Over the Age of 75 |
| Choctaw | 20.2 /100 | #192 | Fair 12.5% |
| Taiwanese | 17.8 /100 | #193 | Poor 12.6% |
| Alsatians | 17.7 /100 | #194 | Poor 12.6% |
| Immigrants | France | 17.4 /100 | #195 | Poor 12.6% |
| Immigrants | Eastern Europe | 16.0 /100 | #196 | Poor 12.6% |
| Nepalese | 14.4 /100 | #197 | Poor 12.6% |
| Chileans | 13.7 /100 | #198 | Poor 12.6% |
| Immigrants | Lebanon | 12.7 /100 | #199 | Poor 12.7% |
| Immigrants | Vietnam | 12.1 /100 | #200 | Poor 12.7% |
| Paraguayans | 11.1 /100 | #201 | Poor 12.7% |
| Arapaho | 10.9 /100 | #202 | Poor 12.7% |
| Immigrants | Southern Europe | 10.7 /100 | #203 | Poor 12.7% |
| Immigrants | Eritrea | 10.5 /100 | #204 | Poor 12.7% |
| Indians (Asian) | 9.7 /100 | #205 | Tragic 12.7% |
| Albanians | 9.6 /100 | #206 | Tragic 12.7% |