Spanish American vs Immigrants from Lebanon Nursery School
COMPARE
Spanish American
Immigrants from Lebanon
Nursery School
Nursery School Comparison
Spanish Americans
Immigrants from Lebanon
98.0%
NURSERY SCHOOL
55.6/ 100
METRIC RATING
166th/ 347
METRIC RANK
97.9%
NURSERY SCHOOL
21.2/ 100
METRIC RATING
201st/ 347
METRIC RANK
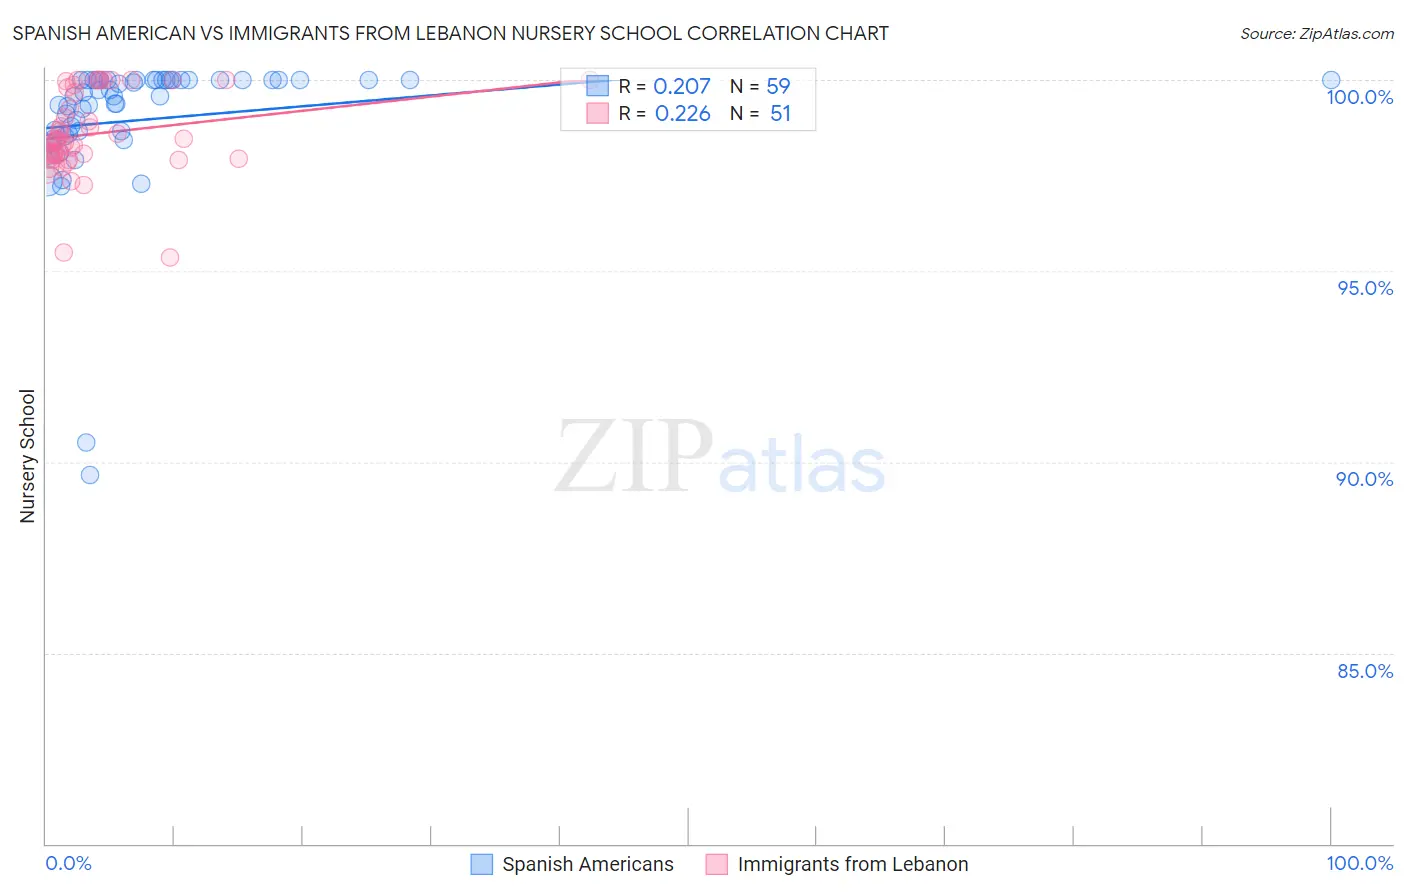
Spanish American vs Immigrants from Lebanon Nursery School Correlation Chart
The statistical analysis conducted on geographies consisting of 103,168,542 people shows a weak positive correlation between the proportion of Spanish Americans and percentage of population with at least nursery school education in the United States with a correlation coefficient (R) of 0.207 and weighted average of 98.0%. Similarly, the statistical analysis conducted on geographies consisting of 217,102,284 people shows a weak positive correlation between the proportion of Immigrants from Lebanon and percentage of population with at least nursery school education in the United States with a correlation coefficient (R) of 0.226 and weighted average of 97.9%, a difference of 0.12%.
Nursery School Correlation Summary
| Measurement | Spanish American | Immigrants from Lebanon |
| Minimum | 89.6% | 95.4% |
| Maximum | 100.0% | 100.0% |
| Range | 10.4% | 4.6% |
| Mean | 99.0% | 98.6% |
| Median | 99.6% | 98.4% |
| Interquartile 25% (IQ1) | 98.5% | 98.0% |
| Interquartile 75% (IQ3) | 100.0% | 99.8% |
| Interquartile Range (IQR) | 1.5% | 1.8% |
| Standard Deviation (Sample) | 1.9% | 1.1% |
| Standard Deviation (Population) | 1.9% | 1.1% |
Similar Demographics by Nursery School
Demographics Similar to Spanish Americans by Nursery School
In terms of nursery school, the demographic groups most similar to Spanish Americans are Ugandan (98.0%, a difference of 0.0%), Chilean (98.0%, a difference of 0.0%), Immigrants from Spain (98.0%, a difference of 0.0%), Immigrants from Micronesia (98.0%, a difference of 0.0%), and Immigrants from Russia (98.0%, a difference of 0.010%).
| Demographics | Rating | Rank | Nursery School |
| French American Indians | 62.1 /100 | #159 | Good 98.0% |
| Immigrants | Russia | 59.9 /100 | #160 | Average 98.0% |
| Immigrants | Eastern Europe | 59.7 /100 | #161 | Average 98.0% |
| Brazilians | 59.4 /100 | #162 | Average 98.0% |
| Immigrants | Italy | 59.0 /100 | #163 | Average 98.0% |
| Ugandans | 56.4 /100 | #164 | Average 98.0% |
| Chileans | 56.4 /100 | #165 | Average 98.0% |
| Spanish Americans | 55.6 /100 | #166 | Average 98.0% |
| Immigrants | Spain | 55.6 /100 | #167 | Average 98.0% |
| Immigrants | Micronesia | 55.0 /100 | #168 | Average 98.0% |
| Immigrants | Korea | 53.8 /100 | #169 | Average 98.0% |
| Bermudans | 53.7 /100 | #170 | Average 98.0% |
| Immigrants | Jordan | 53.4 /100 | #171 | Average 98.0% |
| Immigrants | Brazil | 51.3 /100 | #172 | Average 98.0% |
| Kenyans | 50.2 /100 | #173 | Average 98.0% |
Demographics Similar to Immigrants from Lebanon by Nursery School
In terms of nursery school, the demographic groups most similar to Immigrants from Lebanon are Tohono O'odham (97.9%, a difference of 0.0%), Immigrants from Kenya (97.9%, a difference of 0.010%), Immigrants from Egypt (97.9%, a difference of 0.010%), Immigrants from Ukraine (97.9%, a difference of 0.010%), and Hawaiian (97.9%, a difference of 0.020%).
| Demographics | Rating | Rank | Nursery School |
| Mongolians | 27.3 /100 | #194 | Fair 97.9% |
| Hawaiians | 27.2 /100 | #195 | Fair 97.9% |
| Guamanians/Chamorros | 25.7 /100 | #196 | Fair 97.9% |
| Yuman | 25.7 /100 | #197 | Fair 97.9% |
| Immigrants | Kenya | 24.1 /100 | #198 | Fair 97.9% |
| Immigrants | Egypt | 22.5 /100 | #199 | Fair 97.9% |
| Tohono O'odham | 22.2 /100 | #200 | Fair 97.9% |
| Immigrants | Lebanon | 21.2 /100 | #201 | Fair 97.9% |
| Immigrants | Ukraine | 19.9 /100 | #202 | Poor 97.9% |
| Immigrants | Uganda | 18.0 /100 | #203 | Poor 97.9% |
| Immigrants | Southern Europe | 17.4 /100 | #204 | Poor 97.9% |
| Immigrants | Chile | 17.3 /100 | #205 | Poor 97.9% |
| Immigrants | Albania | 16.4 /100 | #206 | Poor 97.9% |
| Africans | 15.4 /100 | #207 | Poor 97.9% |
| Immigrants | Northern Africa | 11.7 /100 | #208 | Poor 97.8% |