Immigrants from Russia vs Immigrants from Lebanon Poverty
COMPARE
Immigrants from Russia
Immigrants from Lebanon
Poverty
Poverty Comparison
Immigrants from Russia
Immigrants from Lebanon
11.7%
POVERTY
89.7/ 100
METRIC RATING
116th/ 347
METRIC RANK
12.8%
POVERTY
18.7/ 100
METRIC RATING
197th/ 347
METRIC RANK
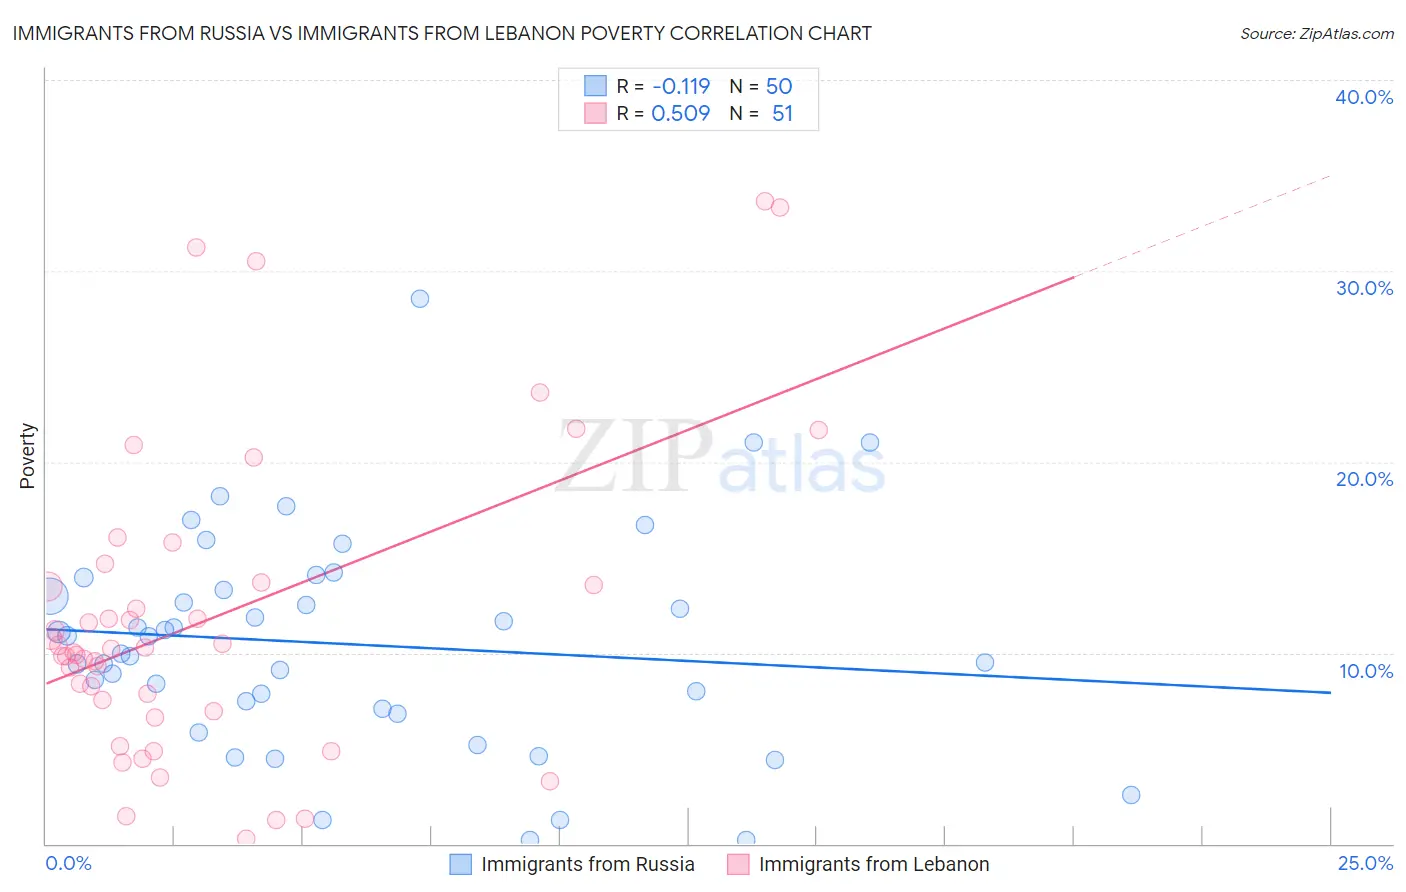
Immigrants from Russia vs Immigrants from Lebanon Poverty Correlation Chart
The statistical analysis conducted on geographies consisting of 347,709,239 people shows a poor negative correlation between the proportion of Immigrants from Russia and poverty level in the United States with a correlation coefficient (R) of -0.119 and weighted average of 11.7%. Similarly, the statistical analysis conducted on geographies consisting of 217,129,888 people shows a substantial positive correlation between the proportion of Immigrants from Lebanon and poverty level in the United States with a correlation coefficient (R) of 0.509 and weighted average of 12.8%, a difference of 9.3%.
Poverty Correlation Summary
| Measurement | Immigrants from Russia | Immigrants from Lebanon |
| Minimum | 0.17% | 0.24% |
| Maximum | 28.6% | 33.6% |
| Range | 28.4% | 33.4% |
| Mean | 10.4% | 11.8% |
| Median | 10.4% | 10.2% |
| Interquartile 25% (IQ1) | 7.1% | 6.9% |
| Interquartile 75% (IQ3) | 13.3% | 13.7% |
| Interquartile Range (IQR) | 6.2% | 6.8% |
| Standard Deviation (Sample) | 5.7% | 8.0% |
| Standard Deviation (Population) | 5.6% | 7.9% |
Similar Demographics by Poverty
Demographics Similar to Immigrants from Russia by Poverty
In terms of poverty, the demographic groups most similar to Immigrants from Russia are Sri Lankan (11.7%, a difference of 0.070%), Argentinean (11.7%, a difference of 0.15%), Albanian (11.7%, a difference of 0.17%), Tlingit-Haida (11.7%, a difference of 0.19%), and Immigrants from South Eastern Asia (11.7%, a difference of 0.20%).
| Demographics | Rating | Rank | Poverty |
| Immigrants | Turkey | 91.7 /100 | #109 | Exceptional 11.6% |
| Welsh | 91.6 /100 | #110 | Exceptional 11.6% |
| French Canadians | 91.0 /100 | #111 | Exceptional 11.6% |
| Immigrants | Southern Europe | 90.8 /100 | #112 | Exceptional 11.6% |
| Immigrants | Belarus | 90.8 /100 | #113 | Exceptional 11.6% |
| Immigrants | China | 90.7 /100 | #114 | Exceptional 11.6% |
| Albanians | 90.3 /100 | #115 | Exceptional 11.7% |
| Immigrants | Russia | 89.7 /100 | #116 | Excellent 11.7% |
| Sri Lankans | 89.4 /100 | #117 | Excellent 11.7% |
| Argentineans | 89.1 /100 | #118 | Excellent 11.7% |
| Tlingit-Haida | 89.0 /100 | #119 | Excellent 11.7% |
| Immigrants | South Eastern Asia | 88.9 /100 | #120 | Excellent 11.7% |
| New Zealanders | 88.7 /100 | #121 | Excellent 11.7% |
| Puget Sound Salish | 88.7 /100 | #122 | Excellent 11.7% |
| Immigrants | Hungary | 88.6 /100 | #123 | Excellent 11.7% |
Demographics Similar to Immigrants from Lebanon by Poverty
In terms of poverty, the demographic groups most similar to Immigrants from Lebanon are Spanish (12.8%, a difference of 0.010%), Immigrants from Kenya (12.8%, a difference of 0.20%), Iraqi (12.7%, a difference of 0.31%), Immigrants from Kuwait (12.7%, a difference of 0.32%), and Spaniard (12.8%, a difference of 0.35%).
| Demographics | Rating | Rank | Poverty |
| Immigrants | South America | 32.3 /100 | #190 | Fair 12.5% |
| Sierra Leoneans | 31.5 /100 | #191 | Fair 12.6% |
| South American Indians | 23.3 /100 | #192 | Fair 12.7% |
| Delaware | 21.4 /100 | #193 | Fair 12.7% |
| Arabs | 21.1 /100 | #194 | Fair 12.7% |
| Immigrants | Kuwait | 20.9 /100 | #195 | Fair 12.7% |
| Iraqis | 20.8 /100 | #196 | Fair 12.7% |
| Immigrants | Lebanon | 18.7 /100 | #197 | Poor 12.8% |
| Spanish | 18.7 /100 | #198 | Poor 12.8% |
| Immigrants | Kenya | 17.5 /100 | #199 | Poor 12.8% |
| Spaniards | 16.5 /100 | #200 | Poor 12.8% |
| Immigrants | Uganda | 16.5 /100 | #201 | Poor 12.8% |
| Immigrants | Uruguay | 15.6 /100 | #202 | Poor 12.8% |
| Hmong | 15.0 /100 | #203 | Poor 12.8% |
| Immigrants | Western Asia | 14.1 /100 | #204 | Poor 12.9% |