Spanish American Indian vs Palestinian Child Poverty Under the Age of 5
COMPARE
Spanish American Indian
Palestinian
Child Poverty Under the Age of 5
Child Poverty Under the Age of 5 Comparison
Spanish American Indians
Palestinians
20.2%
CHILD POVERTY UNDER THE AGE OF 5
0.1/ 100
METRIC RATING
265th/ 347
METRIC RANK
15.8%
CHILD POVERTY UNDER THE AGE OF 5
95.9/ 100
METRIC RATING
99th/ 347
METRIC RANK
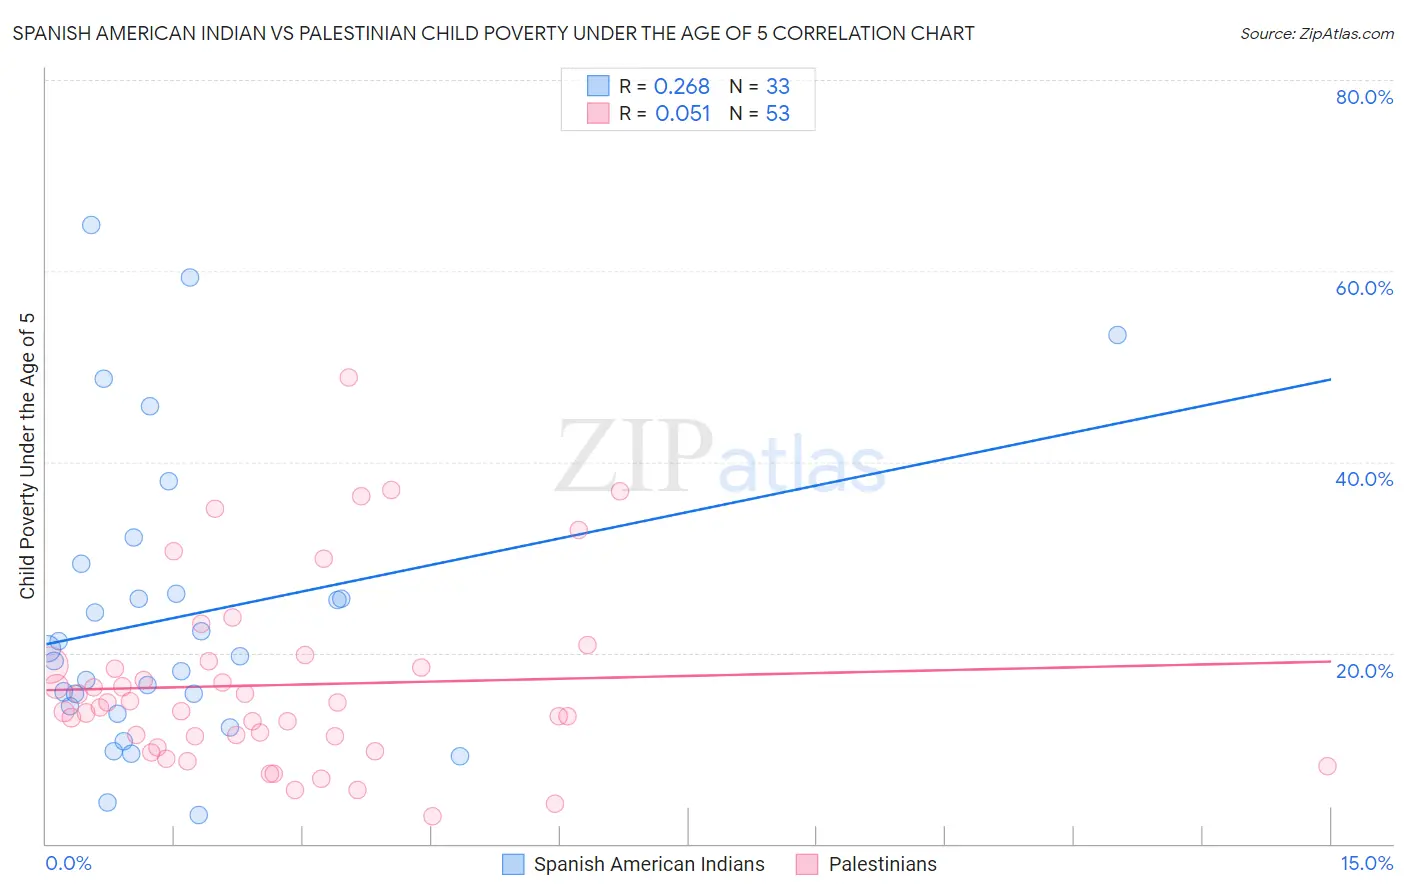
Spanish American Indian vs Palestinian Child Poverty Under the Age of 5 Correlation Chart
The statistical analysis conducted on geographies consisting of 72,897,748 people shows a weak positive correlation between the proportion of Spanish American Indians and poverty level among children under the age of 5 in the United States with a correlation coefficient (R) of 0.268 and weighted average of 20.2%. Similarly, the statistical analysis conducted on geographies consisting of 211,703,351 people shows a slight positive correlation between the proportion of Palestinians and poverty level among children under the age of 5 in the United States with a correlation coefficient (R) of 0.051 and weighted average of 15.8%, a difference of 27.9%.
Child Poverty Under the Age of 5 Correlation Summary
| Measurement | Spanish American Indian | Palestinian |
| Minimum | 3.1% | 2.9% |
| Maximum | 64.8% | 48.8% |
| Range | 61.7% | 45.9% |
| Mean | 23.8% | 16.6% |
| Median | 19.6% | 14.3% |
| Interquartile 25% (IQ1) | 14.0% | 10.7% |
| Interquartile 75% (IQ3) | 27.7% | 18.9% |
| Interquartile Range (IQR) | 13.7% | 8.3% |
| Standard Deviation (Sample) | 15.4% | 9.6% |
| Standard Deviation (Population) | 15.1% | 9.5% |
Similar Demographics by Child Poverty Under the Age of 5
Demographics Similar to Spanish American Indians by Child Poverty Under the Age of 5
In terms of child poverty under the age of 5, the demographic groups most similar to Spanish American Indians are Immigrants from Liberia (20.2%, a difference of 0.12%), Aleut (20.3%, a difference of 0.13%), Barbadian (20.2%, a difference of 0.24%), Liberian (20.2%, a difference of 0.31%), and Ottawa (20.3%, a difference of 0.52%).
| Demographics | Rating | Rank | Child Poverty Under the Age of 5 |
| Immigrants | St. Vincent and the Grenadines | 0.2 /100 | #258 | Tragic 20.0% |
| Immigrants | El Salvador | 0.2 /100 | #259 | Tragic 20.0% |
| Spanish Americans | 0.2 /100 | #260 | Tragic 20.1% |
| Immigrants | Bangladesh | 0.2 /100 | #261 | Tragic 20.1% |
| Liberians | 0.1 /100 | #262 | Tragic 20.2% |
| Barbadians | 0.1 /100 | #263 | Tragic 20.2% |
| Immigrants | Liberia | 0.1 /100 | #264 | Tragic 20.2% |
| Spanish American Indians | 0.1 /100 | #265 | Tragic 20.2% |
| Aleuts | 0.1 /100 | #266 | Tragic 20.3% |
| Ottawa | 0.1 /100 | #267 | Tragic 20.3% |
| Belizeans | 0.1 /100 | #268 | Tragic 20.3% |
| Immigrants | Burma/Myanmar | 0.1 /100 | #269 | Tragic 20.4% |
| Jamaicans | 0.1 /100 | #270 | Tragic 20.4% |
| Americans | 0.1 /100 | #271 | Tragic 20.5% |
| Immigrants | Jamaica | 0.1 /100 | #272 | Tragic 20.5% |
Demographics Similar to Palestinians by Child Poverty Under the Age of 5
In terms of child poverty under the age of 5, the demographic groups most similar to Palestinians are Immigrants from Canada (15.8%, a difference of 0.010%), Immigrants from Zimbabwe (15.8%, a difference of 0.020%), Immigrants from South Africa (15.8%, a difference of 0.11%), Armenian (15.8%, a difference of 0.15%), and Macedonian (15.8%, a difference of 0.18%).
| Demographics | Rating | Rank | Child Poverty Under the Age of 5 |
| Scandinavians | 97.1 /100 | #92 | Exceptional 15.7% |
| Ukrainians | 97.1 /100 | #93 | Exceptional 15.7% |
| Immigrants | South Eastern Asia | 97.1 /100 | #94 | Exceptional 15.7% |
| Immigrants | Switzerland | 96.4 /100 | #95 | Exceptional 15.8% |
| Immigrants | Kazakhstan | 96.2 /100 | #96 | Exceptional 15.8% |
| Macedonians | 96.2 /100 | #97 | Exceptional 15.8% |
| Immigrants | South Africa | 96.1 /100 | #98 | Exceptional 15.8% |
| Palestinians | 95.9 /100 | #99 | Exceptional 15.8% |
| Immigrants | Canada | 95.9 /100 | #100 | Exceptional 15.8% |
| Immigrants | Zimbabwe | 95.9 /100 | #101 | Exceptional 15.8% |
| Armenians | 95.7 /100 | #102 | Exceptional 15.8% |
| Europeans | 95.3 /100 | #103 | Exceptional 15.9% |
| Immigrants | North America | 94.9 /100 | #104 | Exceptional 15.9% |
| Immigrants | Spain | 94.8 /100 | #105 | Exceptional 15.9% |
| Tlingit-Haida | 94.7 /100 | #106 | Exceptional 15.9% |