Spanish American Indian vs Dutch West Indian Child Poverty Under the Age of 5
COMPARE
Spanish American Indian
Dutch West Indian
Child Poverty Under the Age of 5
Child Poverty Under the Age of 5 Comparison
Spanish American Indians
Dutch West Indians
20.2%
CHILD POVERTY UNDER THE AGE OF 5
0.1/ 100
METRIC RATING
265th/ 347
METRIC RANK
23.3%
CHILD POVERTY UNDER THE AGE OF 5
0.0/ 100
METRIC RATING
318th/ 347
METRIC RANK
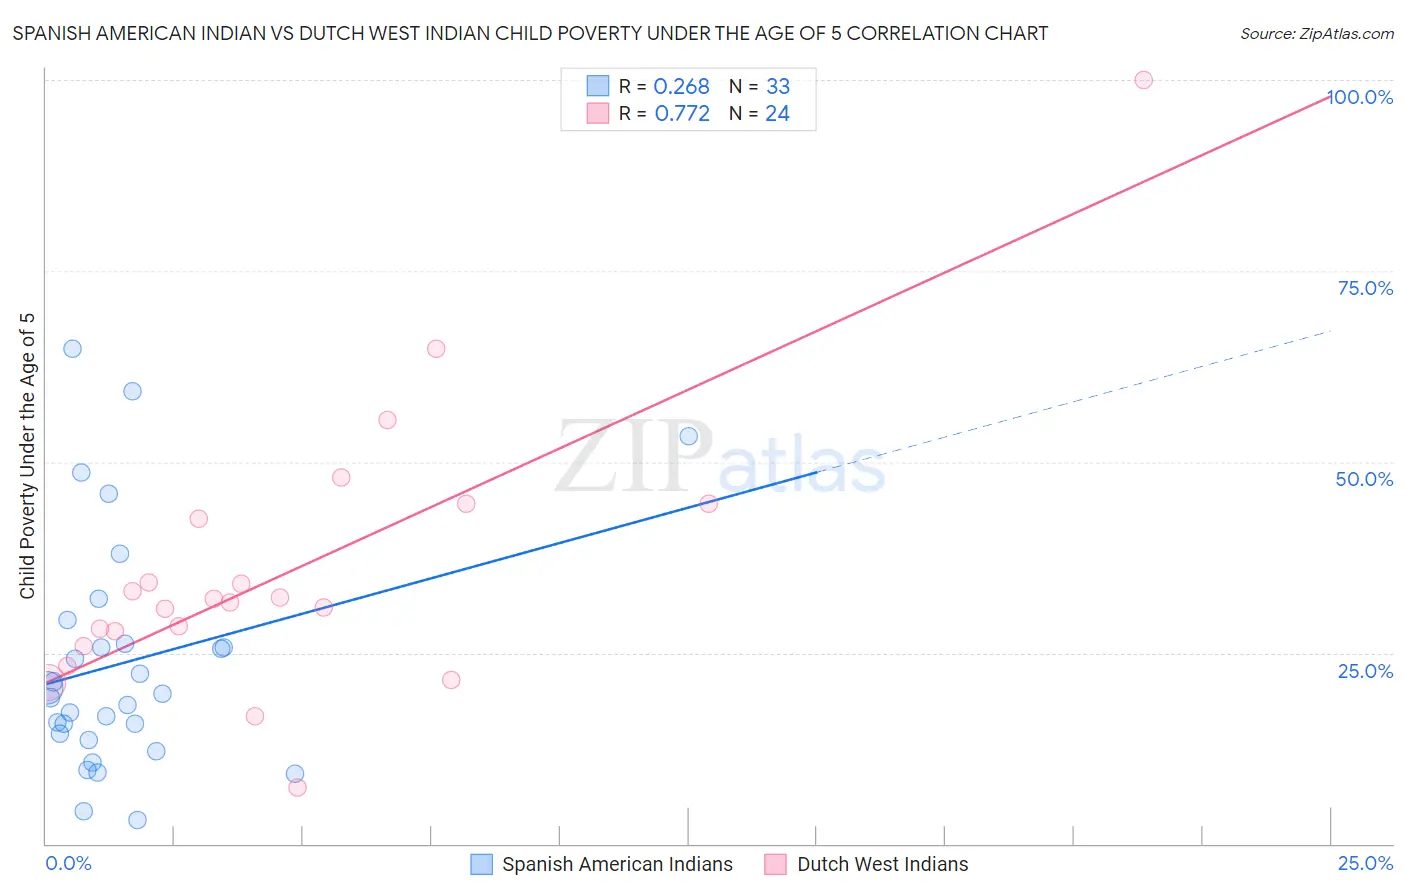
Spanish American Indian vs Dutch West Indian Child Poverty Under the Age of 5 Correlation Chart
The statistical analysis conducted on geographies consisting of 72,897,748 people shows a weak positive correlation between the proportion of Spanish American Indians and poverty level among children under the age of 5 in the United States with a correlation coefficient (R) of 0.268 and weighted average of 20.2%. Similarly, the statistical analysis conducted on geographies consisting of 85,247,098 people shows a strong positive correlation between the proportion of Dutch West Indians and poverty level among children under the age of 5 in the United States with a correlation coefficient (R) of 0.772 and weighted average of 23.3%, a difference of 15.1%.
Child Poverty Under the Age of 5 Correlation Summary
| Measurement | Spanish American Indian | Dutch West Indian |
| Minimum | 3.1% | 7.4% |
| Maximum | 64.8% | 100.0% |
| Range | 61.7% | 92.6% |
| Mean | 23.8% | 35.8% |
| Median | 19.6% | 31.8% |
| Interquartile 25% (IQ1) | 14.0% | 26.9% |
| Interquartile 75% (IQ3) | 27.7% | 43.5% |
| Interquartile Range (IQR) | 13.7% | 16.6% |
| Standard Deviation (Sample) | 15.4% | 18.5% |
| Standard Deviation (Population) | 15.1% | 18.1% |
Similar Demographics by Child Poverty Under the Age of 5
Demographics Similar to Spanish American Indians by Child Poverty Under the Age of 5
In terms of child poverty under the age of 5, the demographic groups most similar to Spanish American Indians are Immigrants from Liberia (20.2%, a difference of 0.12%), Aleut (20.3%, a difference of 0.13%), Barbadian (20.2%, a difference of 0.24%), Liberian (20.2%, a difference of 0.31%), and Ottawa (20.3%, a difference of 0.52%).
| Demographics | Rating | Rank | Child Poverty Under the Age of 5 |
| Immigrants | St. Vincent and the Grenadines | 0.2 /100 | #258 | Tragic 20.0% |
| Immigrants | El Salvador | 0.2 /100 | #259 | Tragic 20.0% |
| Spanish Americans | 0.2 /100 | #260 | Tragic 20.1% |
| Immigrants | Bangladesh | 0.2 /100 | #261 | Tragic 20.1% |
| Liberians | 0.1 /100 | #262 | Tragic 20.2% |
| Barbadians | 0.1 /100 | #263 | Tragic 20.2% |
| Immigrants | Liberia | 0.1 /100 | #264 | Tragic 20.2% |
| Spanish American Indians | 0.1 /100 | #265 | Tragic 20.2% |
| Aleuts | 0.1 /100 | #266 | Tragic 20.3% |
| Ottawa | 0.1 /100 | #267 | Tragic 20.3% |
| Belizeans | 0.1 /100 | #268 | Tragic 20.3% |
| Immigrants | Burma/Myanmar | 0.1 /100 | #269 | Tragic 20.4% |
| Jamaicans | 0.1 /100 | #270 | Tragic 20.4% |
| Americans | 0.1 /100 | #271 | Tragic 20.5% |
| Immigrants | Jamaica | 0.1 /100 | #272 | Tragic 20.5% |
Demographics Similar to Dutch West Indians by Child Poverty Under the Age of 5
In terms of child poverty under the age of 5, the demographic groups most similar to Dutch West Indians are Menominee (23.3%, a difference of 0.10%), Chippewa (23.4%, a difference of 0.48%), Yakama (23.1%, a difference of 0.60%), Arapaho (23.1%, a difference of 0.72%), and Choctaw (23.5%, a difference of 0.86%).
| Demographics | Rating | Rank | Child Poverty Under the Age of 5 |
| Seminole | 0.0 /100 | #311 | Tragic 22.8% |
| Hondurans | 0.0 /100 | #312 | Tragic 23.0% |
| Bahamians | 0.0 /100 | #313 | Tragic 23.0% |
| U.S. Virgin Islanders | 0.0 /100 | #314 | Tragic 23.0% |
| Arapaho | 0.0 /100 | #315 | Tragic 23.1% |
| Yakama | 0.0 /100 | #316 | Tragic 23.1% |
| Menominee | 0.0 /100 | #317 | Tragic 23.3% |
| Dutch West Indians | 0.0 /100 | #318 | Tragic 23.3% |
| Chippewa | 0.0 /100 | #319 | Tragic 23.4% |
| Choctaw | 0.0 /100 | #320 | Tragic 23.5% |
| Immigrants | Honduras | 0.0 /100 | #321 | Tragic 23.5% |
| Ute | 0.0 /100 | #322 | Tragic 23.5% |
| Pueblo | 0.0 /100 | #323 | Tragic 23.7% |
| Paiute | 0.0 /100 | #324 | Tragic 23.8% |
| Immigrants | Congo | 0.0 /100 | #325 | Tragic 23.9% |