Immigrants from Northern Europe vs Palestinian Child Poverty Under the Age of 5
COMPARE
Immigrants from Northern Europe
Palestinian
Child Poverty Under the Age of 5
Child Poverty Under the Age of 5 Comparison
Immigrants from Northern Europe
Palestinians
14.8%
CHILD POVERTY UNDER THE AGE OF 5
99.6/ 100
METRIC RATING
50th/ 347
METRIC RANK
15.8%
CHILD POVERTY UNDER THE AGE OF 5
95.9/ 100
METRIC RATING
99th/ 347
METRIC RANK
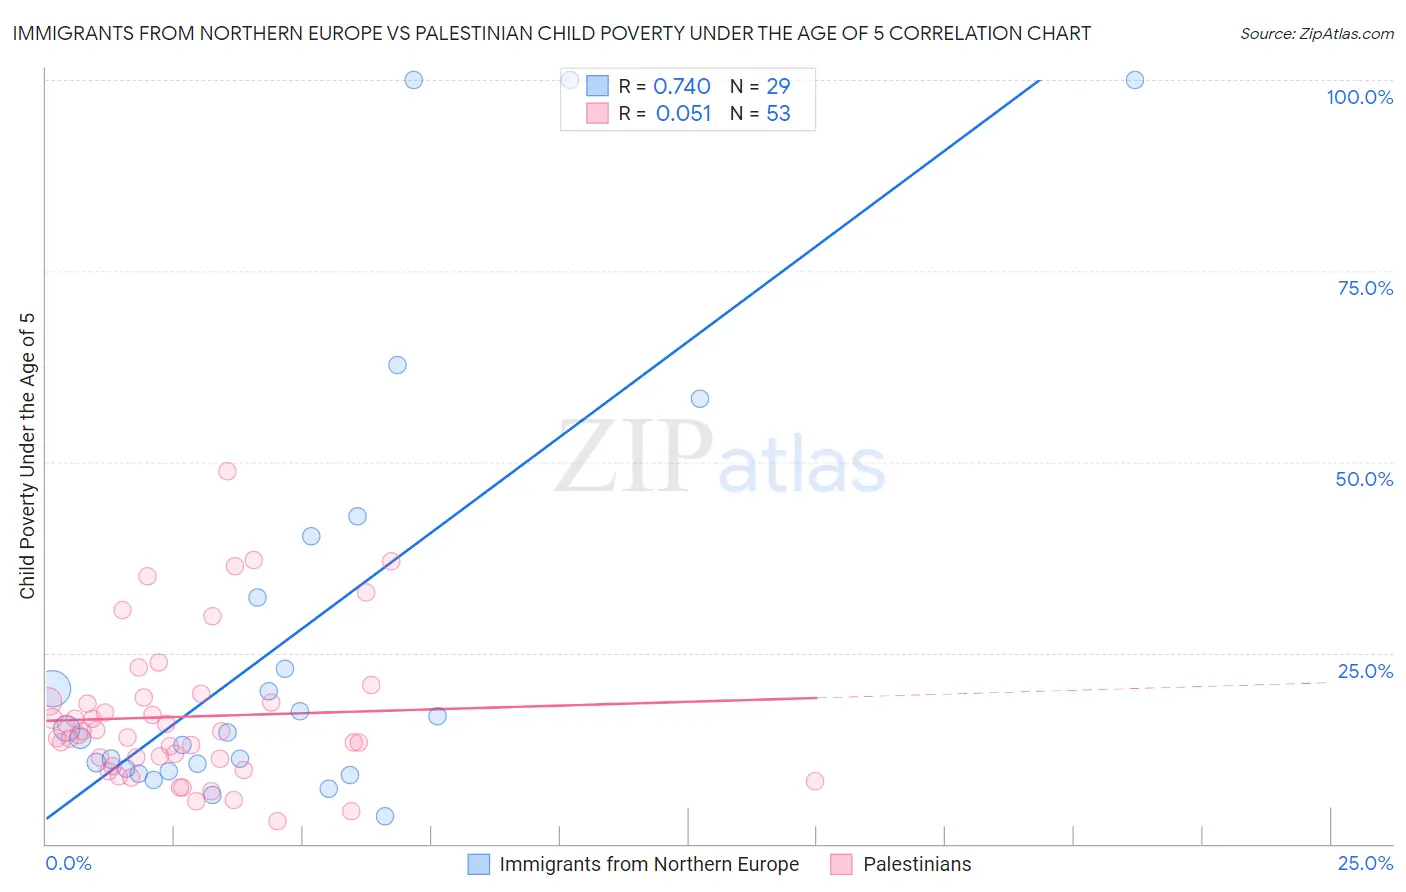
Immigrants from Northern Europe vs Palestinian Child Poverty Under the Age of 5 Correlation Chart
The statistical analysis conducted on geographies consisting of 450,553,782 people shows a strong positive correlation between the proportion of Immigrants from Northern Europe and poverty level among children under the age of 5 in the United States with a correlation coefficient (R) of 0.740 and weighted average of 14.8%. Similarly, the statistical analysis conducted on geographies consisting of 211,703,351 people shows a slight positive correlation between the proportion of Palestinians and poverty level among children under the age of 5 in the United States with a correlation coefficient (R) of 0.051 and weighted average of 15.8%, a difference of 6.9%.
Child Poverty Under the Age of 5 Correlation Summary
| Measurement | Immigrants from Northern Europe | Palestinian |
| Minimum | 3.6% | 2.9% |
| Maximum | 100.0% | 48.8% |
| Range | 96.4% | 45.9% |
| Mean | 27.5% | 16.6% |
| Median | 14.6% | 14.3% |
| Interquartile 25% (IQ1) | 9.7% | 10.7% |
| Interquartile 75% (IQ3) | 36.2% | 18.9% |
| Interquartile Range (IQR) | 26.6% | 8.3% |
| Standard Deviation (Sample) | 29.1% | 9.6% |
| Standard Deviation (Population) | 28.6% | 9.5% |
Similar Demographics by Child Poverty Under the Age of 5
Demographics Similar to Immigrants from Northern Europe by Child Poverty Under the Age of 5
In terms of child poverty under the age of 5, the demographic groups most similar to Immigrants from Northern Europe are Estonian (14.8%, a difference of 0.040%), Immigrants from Bulgaria (14.8%, a difference of 0.090%), Immigrants from Czechoslovakia (14.8%, a difference of 0.24%), Russian (14.8%, a difference of 0.35%), and Tsimshian (14.7%, a difference of 0.49%).
| Demographics | Rating | Rank | Child Poverty Under the Age of 5 |
| Immigrants | Greece | 99.7 /100 | #43 | Exceptional 14.7% |
| Immigrants | Philippines | 99.7 /100 | #44 | Exceptional 14.7% |
| Laotians | 99.6 /100 | #45 | Exceptional 14.7% |
| Tsimshian | 99.6 /100 | #46 | Exceptional 14.7% |
| Russians | 99.6 /100 | #47 | Exceptional 14.8% |
| Immigrants | Czechoslovakia | 99.6 /100 | #48 | Exceptional 14.8% |
| Immigrants | Bulgaria | 99.6 /100 | #49 | Exceptional 14.8% |
| Immigrants | Northern Europe | 99.6 /100 | #50 | Exceptional 14.8% |
| Estonians | 99.6 /100 | #51 | Exceptional 14.8% |
| Immigrants | Serbia | 99.5 /100 | #52 | Exceptional 14.9% |
| Luxembourgers | 99.4 /100 | #53 | Exceptional 14.9% |
| Immigrants | Israel | 99.4 /100 | #54 | Exceptional 14.9% |
| Danes | 99.4 /100 | #55 | Exceptional 14.9% |
| Immigrants | Pakistan | 99.4 /100 | #56 | Exceptional 14.9% |
| Egyptians | 99.4 /100 | #57 | Exceptional 14.9% |
Demographics Similar to Palestinians by Child Poverty Under the Age of 5
In terms of child poverty under the age of 5, the demographic groups most similar to Palestinians are Immigrants from Canada (15.8%, a difference of 0.010%), Immigrants from Zimbabwe (15.8%, a difference of 0.020%), Immigrants from South Africa (15.8%, a difference of 0.11%), Armenian (15.8%, a difference of 0.15%), and Macedonian (15.8%, a difference of 0.18%).
| Demographics | Rating | Rank | Child Poverty Under the Age of 5 |
| Scandinavians | 97.1 /100 | #92 | Exceptional 15.7% |
| Ukrainians | 97.1 /100 | #93 | Exceptional 15.7% |
| Immigrants | South Eastern Asia | 97.1 /100 | #94 | Exceptional 15.7% |
| Immigrants | Switzerland | 96.4 /100 | #95 | Exceptional 15.8% |
| Immigrants | Kazakhstan | 96.2 /100 | #96 | Exceptional 15.8% |
| Macedonians | 96.2 /100 | #97 | Exceptional 15.8% |
| Immigrants | South Africa | 96.1 /100 | #98 | Exceptional 15.8% |
| Palestinians | 95.9 /100 | #99 | Exceptional 15.8% |
| Immigrants | Canada | 95.9 /100 | #100 | Exceptional 15.8% |
| Immigrants | Zimbabwe | 95.9 /100 | #101 | Exceptional 15.8% |
| Armenians | 95.7 /100 | #102 | Exceptional 15.8% |
| Europeans | 95.3 /100 | #103 | Exceptional 15.9% |
| Immigrants | North America | 94.9 /100 | #104 | Exceptional 15.9% |
| Immigrants | Spain | 94.8 /100 | #105 | Exceptional 15.9% |
| Tlingit-Haida | 94.7 /100 | #106 | Exceptional 15.9% |