Spanish American Indian vs Immigrants from Japan Child Poverty Under the Age of 5
COMPARE
Spanish American Indian
Immigrants from Japan
Child Poverty Under the Age of 5
Child Poverty Under the Age of 5 Comparison
Spanish American Indians
Immigrants from Japan
20.2%
CHILD POVERTY UNDER THE AGE OF 5
0.1/ 100
METRIC RATING
265th/ 347
METRIC RANK
13.8%
CHILD POVERTY UNDER THE AGE OF 5
100.0/ 100
METRIC RATING
20th/ 347
METRIC RANK
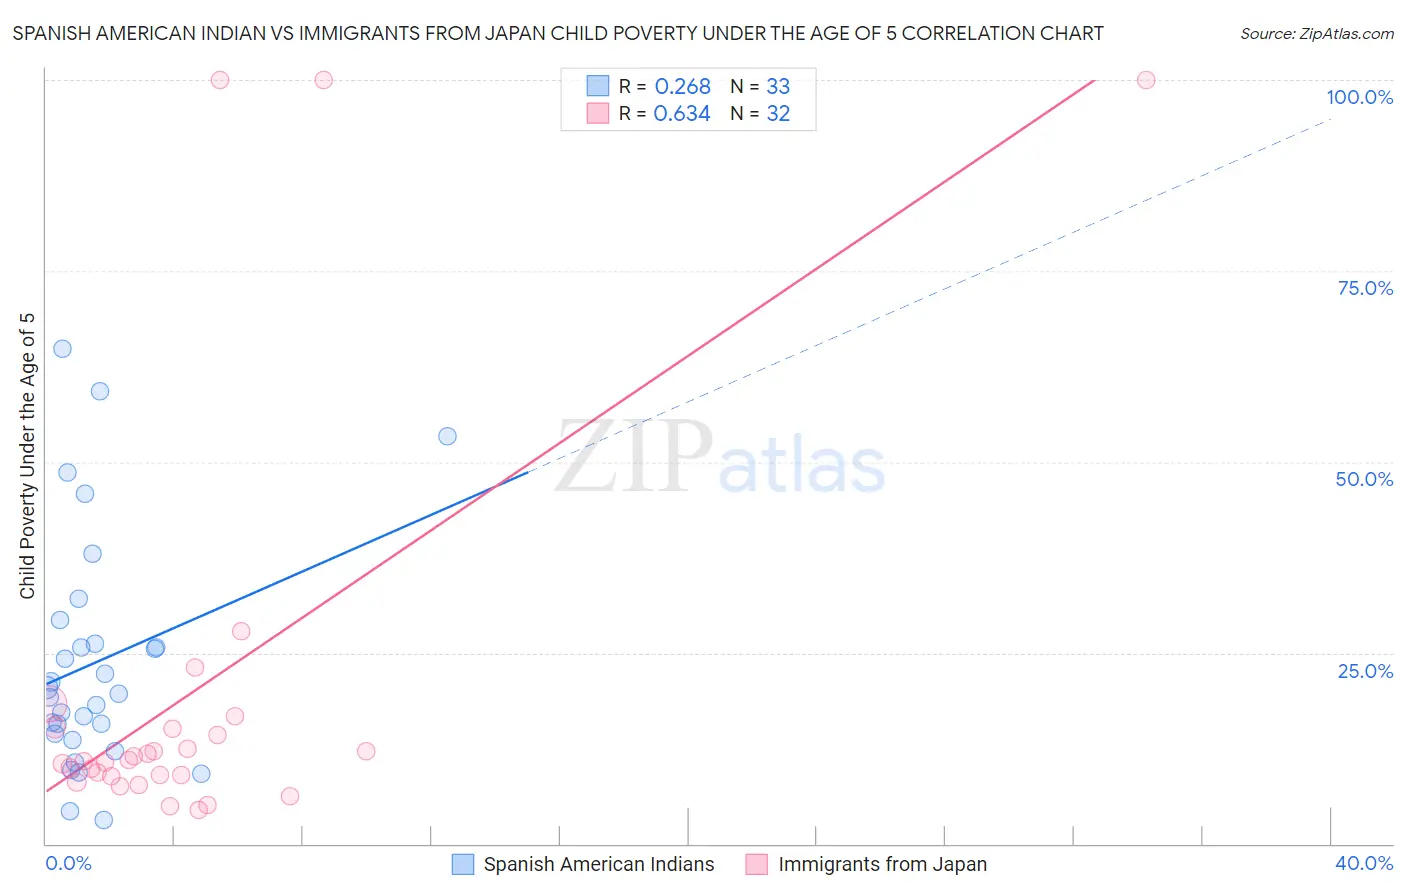
Spanish American Indian vs Immigrants from Japan Child Poverty Under the Age of 5 Correlation Chart
The statistical analysis conducted on geographies consisting of 72,897,748 people shows a weak positive correlation between the proportion of Spanish American Indians and poverty level among children under the age of 5 in the United States with a correlation coefficient (R) of 0.268 and weighted average of 20.2%. Similarly, the statistical analysis conducted on geographies consisting of 328,132,973 people shows a significant positive correlation between the proportion of Immigrants from Japan and poverty level among children under the age of 5 in the United States with a correlation coefficient (R) of 0.634 and weighted average of 13.8%, a difference of 46.8%.
Child Poverty Under the Age of 5 Correlation Summary
| Measurement | Spanish American Indian | Immigrants from Japan |
| Minimum | 3.1% | 4.4% |
| Maximum | 64.8% | 100.0% |
| Range | 61.7% | 95.6% |
| Mean | 23.8% | 19.8% |
| Median | 19.6% | 10.9% |
| Interquartile 25% (IQ1) | 14.0% | 8.9% |
| Interquartile 75% (IQ3) | 27.7% | 15.1% |
| Interquartile Range (IQR) | 13.7% | 6.2% |
| Standard Deviation (Sample) | 15.4% | 26.7% |
| Standard Deviation (Population) | 15.1% | 26.2% |
Similar Demographics by Child Poverty Under the Age of 5
Demographics Similar to Spanish American Indians by Child Poverty Under the Age of 5
In terms of child poverty under the age of 5, the demographic groups most similar to Spanish American Indians are Immigrants from Liberia (20.2%, a difference of 0.12%), Aleut (20.3%, a difference of 0.13%), Barbadian (20.2%, a difference of 0.24%), Liberian (20.2%, a difference of 0.31%), and Ottawa (20.3%, a difference of 0.52%).
| Demographics | Rating | Rank | Child Poverty Under the Age of 5 |
| Immigrants | St. Vincent and the Grenadines | 0.2 /100 | #258 | Tragic 20.0% |
| Immigrants | El Salvador | 0.2 /100 | #259 | Tragic 20.0% |
| Spanish Americans | 0.2 /100 | #260 | Tragic 20.1% |
| Immigrants | Bangladesh | 0.2 /100 | #261 | Tragic 20.1% |
| Liberians | 0.1 /100 | #262 | Tragic 20.2% |
| Barbadians | 0.1 /100 | #263 | Tragic 20.2% |
| Immigrants | Liberia | 0.1 /100 | #264 | Tragic 20.2% |
| Spanish American Indians | 0.1 /100 | #265 | Tragic 20.2% |
| Aleuts | 0.1 /100 | #266 | Tragic 20.3% |
| Ottawa | 0.1 /100 | #267 | Tragic 20.3% |
| Belizeans | 0.1 /100 | #268 | Tragic 20.3% |
| Immigrants | Burma/Myanmar | 0.1 /100 | #269 | Tragic 20.4% |
| Jamaicans | 0.1 /100 | #270 | Tragic 20.4% |
| Americans | 0.1 /100 | #271 | Tragic 20.5% |
| Immigrants | Jamaica | 0.1 /100 | #272 | Tragic 20.5% |
Demographics Similar to Immigrants from Japan by Child Poverty Under the Age of 5
In terms of child poverty under the age of 5, the demographic groups most similar to Immigrants from Japan are Bolivian (13.8%, a difference of 0.30%), Immigrants from Bolivia (13.8%, a difference of 0.38%), Immigrants from Ireland (13.7%, a difference of 0.40%), Bulgarian (13.9%, a difference of 0.82%), and Immigrants from China (13.6%, a difference of 1.3%).
| Demographics | Rating | Rank | Child Poverty Under the Age of 5 |
| Bhutanese | 100.0 /100 | #13 | Exceptional 13.4% |
| Okinawans | 100.0 /100 | #14 | Exceptional 13.4% |
| Indians (Asian) | 100.0 /100 | #15 | Exceptional 13.4% |
| Immigrants | Eastern Asia | 100.0 /100 | #16 | Exceptional 13.5% |
| Assyrians/Chaldeans/Syriacs | 100.0 /100 | #17 | Exceptional 13.6% |
| Immigrants | China | 100.0 /100 | #18 | Exceptional 13.6% |
| Immigrants | Ireland | 100.0 /100 | #19 | Exceptional 13.7% |
| Immigrants | Japan | 100.0 /100 | #20 | Exceptional 13.8% |
| Bolivians | 100.0 /100 | #21 | Exceptional 13.8% |
| Immigrants | Bolivia | 100.0 /100 | #22 | Exceptional 13.8% |
| Bulgarians | 99.9 /100 | #23 | Exceptional 13.9% |
| Asians | 99.9 /100 | #24 | Exceptional 14.0% |
| Cypriots | 99.9 /100 | #25 | Exceptional 14.0% |
| Immigrants | Lithuania | 99.9 /100 | #26 | Exceptional 14.1% |
| Tongans | 99.9 /100 | #27 | Exceptional 14.2% |