Israeli vs Palestinian Child Poverty Under the Age of 5
COMPARE
Israeli
Palestinian
Child Poverty Under the Age of 5
Child Poverty Under the Age of 5 Comparison
Israelis
Palestinians
16.6%
CHILD POVERTY UNDER THE AGE OF 5
82.0/ 100
METRIC RATING
146th/ 347
METRIC RANK
15.8%
CHILD POVERTY UNDER THE AGE OF 5
95.9/ 100
METRIC RATING
99th/ 347
METRIC RANK
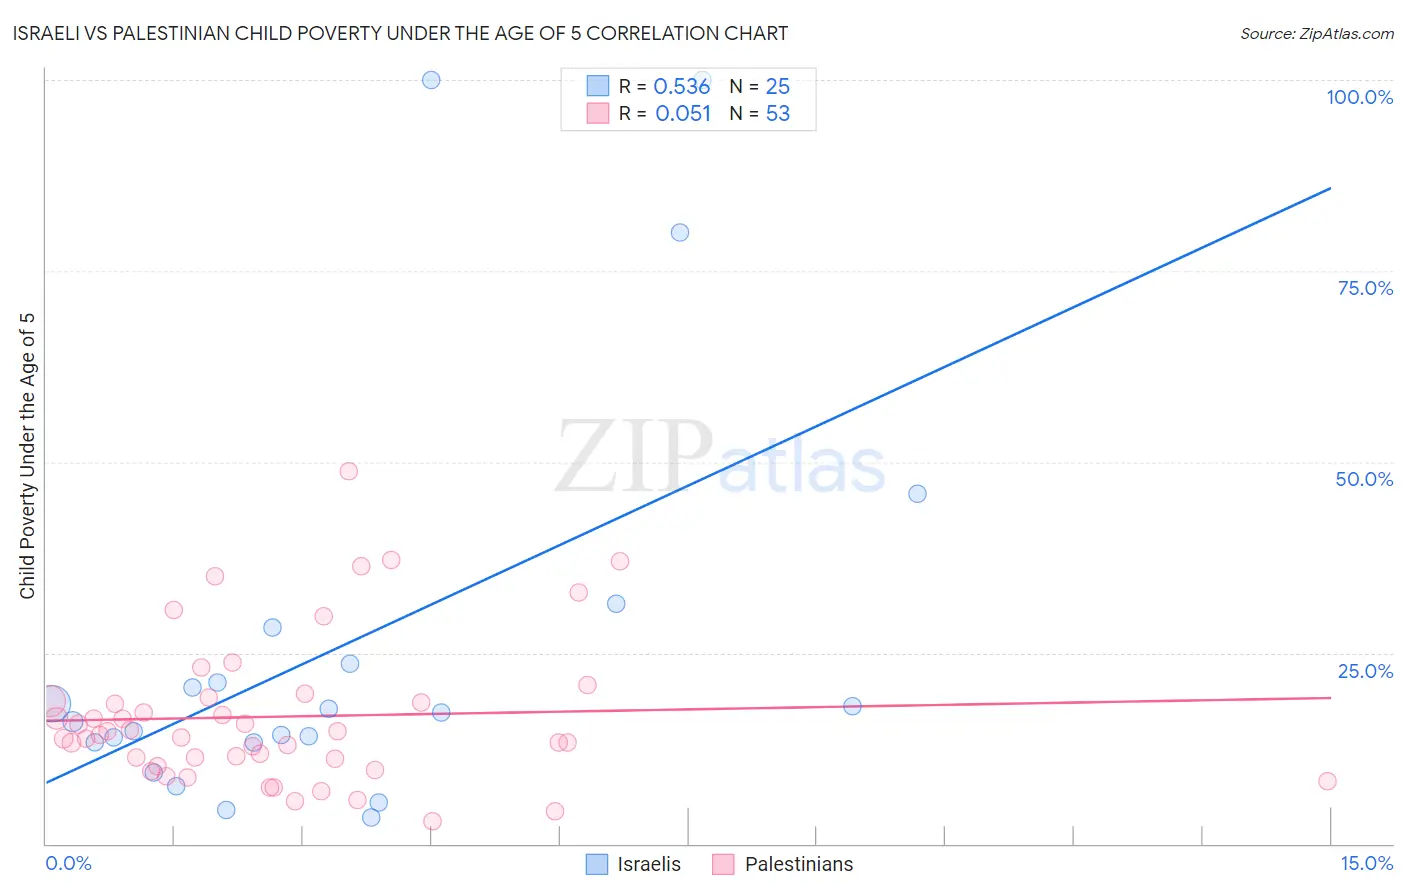
Israeli vs Palestinian Child Poverty Under the Age of 5 Correlation Chart
The statistical analysis conducted on geographies consisting of 203,705,718 people shows a substantial positive correlation between the proportion of Israelis and poverty level among children under the age of 5 in the United States with a correlation coefficient (R) of 0.536 and weighted average of 16.6%. Similarly, the statistical analysis conducted on geographies consisting of 211,703,351 people shows a slight positive correlation between the proportion of Palestinians and poverty level among children under the age of 5 in the United States with a correlation coefficient (R) of 0.051 and weighted average of 15.8%, a difference of 4.6%.
Child Poverty Under the Age of 5 Correlation Summary
| Measurement | Israeli | Palestinian |
| Minimum | 3.4% | 2.9% |
| Maximum | 100.0% | 48.8% |
| Range | 96.6% | 45.9% |
| Mean | 26.1% | 16.6% |
| Median | 17.2% | 14.3% |
| Interquartile 25% (IQ1) | 13.3% | 10.7% |
| Interquartile 75% (IQ3) | 25.9% | 18.9% |
| Interquartile Range (IQR) | 12.7% | 8.3% |
| Standard Deviation (Sample) | 27.1% | 9.6% |
| Standard Deviation (Population) | 26.5% | 9.5% |
Similar Demographics by Child Poverty Under the Age of 5
Demographics Similar to Israelis by Child Poverty Under the Age of 5
In terms of child poverty under the age of 5, the demographic groups most similar to Israelis are Immigrants from Ethiopia (16.6%, a difference of 0.020%), Ethiopian (16.5%, a difference of 0.12%), Samoan (16.5%, a difference of 0.18%), Portuguese (16.5%, a difference of 0.19%), and Immigrants from Western Europe (16.5%, a difference of 0.24%).
| Demographics | Rating | Rank | Child Poverty Under the Age of 5 |
| Immigrants | Hungary | 84.5 /100 | #139 | Excellent 16.5% |
| Guamanians/Chamorros | 84.2 /100 | #140 | Excellent 16.5% |
| Immigrants | Western Europe | 83.3 /100 | #141 | Excellent 16.5% |
| Portuguese | 83.0 /100 | #142 | Excellent 16.5% |
| Samoans | 83.0 /100 | #143 | Excellent 16.5% |
| Ethiopians | 82.7 /100 | #144 | Excellent 16.5% |
| Immigrants | Ethiopia | 82.1 /100 | #145 | Excellent 16.6% |
| Israelis | 82.0 /100 | #146 | Excellent 16.6% |
| Immigrants | Nepal | 80.3 /100 | #147 | Excellent 16.6% |
| Syrians | 79.1 /100 | #148 | Good 16.6% |
| New Zealanders | 78.7 /100 | #149 | Good 16.6% |
| Colombians | 77.8 /100 | #150 | Good 16.7% |
| Canadians | 77.6 /100 | #151 | Good 16.7% |
| Belgians | 77.2 /100 | #152 | Good 16.7% |
| Dutch | 77.1 /100 | #153 | Good 16.7% |
Demographics Similar to Palestinians by Child Poverty Under the Age of 5
In terms of child poverty under the age of 5, the demographic groups most similar to Palestinians are Immigrants from Canada (15.8%, a difference of 0.010%), Immigrants from Zimbabwe (15.8%, a difference of 0.020%), Immigrants from South Africa (15.8%, a difference of 0.11%), Armenian (15.8%, a difference of 0.15%), and Macedonian (15.8%, a difference of 0.18%).
| Demographics | Rating | Rank | Child Poverty Under the Age of 5 |
| Scandinavians | 97.1 /100 | #92 | Exceptional 15.7% |
| Ukrainians | 97.1 /100 | #93 | Exceptional 15.7% |
| Immigrants | South Eastern Asia | 97.1 /100 | #94 | Exceptional 15.7% |
| Immigrants | Switzerland | 96.4 /100 | #95 | Exceptional 15.8% |
| Immigrants | Kazakhstan | 96.2 /100 | #96 | Exceptional 15.8% |
| Macedonians | 96.2 /100 | #97 | Exceptional 15.8% |
| Immigrants | South Africa | 96.1 /100 | #98 | Exceptional 15.8% |
| Palestinians | 95.9 /100 | #99 | Exceptional 15.8% |
| Immigrants | Canada | 95.9 /100 | #100 | Exceptional 15.8% |
| Immigrants | Zimbabwe | 95.9 /100 | #101 | Exceptional 15.8% |
| Armenians | 95.7 /100 | #102 | Exceptional 15.8% |
| Europeans | 95.3 /100 | #103 | Exceptional 15.9% |
| Immigrants | North America | 94.9 /100 | #104 | Exceptional 15.9% |
| Immigrants | Spain | 94.8 /100 | #105 | Exceptional 15.9% |
| Tlingit-Haida | 94.7 /100 | #106 | Exceptional 15.9% |