Basque vs Palestinian Child Poverty Under the Age of 5
COMPARE
Basque
Palestinian
Child Poverty Under the Age of 5
Child Poverty Under the Age of 5 Comparison
Basques
Palestinians
16.0%
CHILD POVERTY UNDER THE AGE OF 5
93.4/ 100
METRIC RATING
117th/ 347
METRIC RANK
15.8%
CHILD POVERTY UNDER THE AGE OF 5
95.9/ 100
METRIC RATING
99th/ 347
METRIC RANK
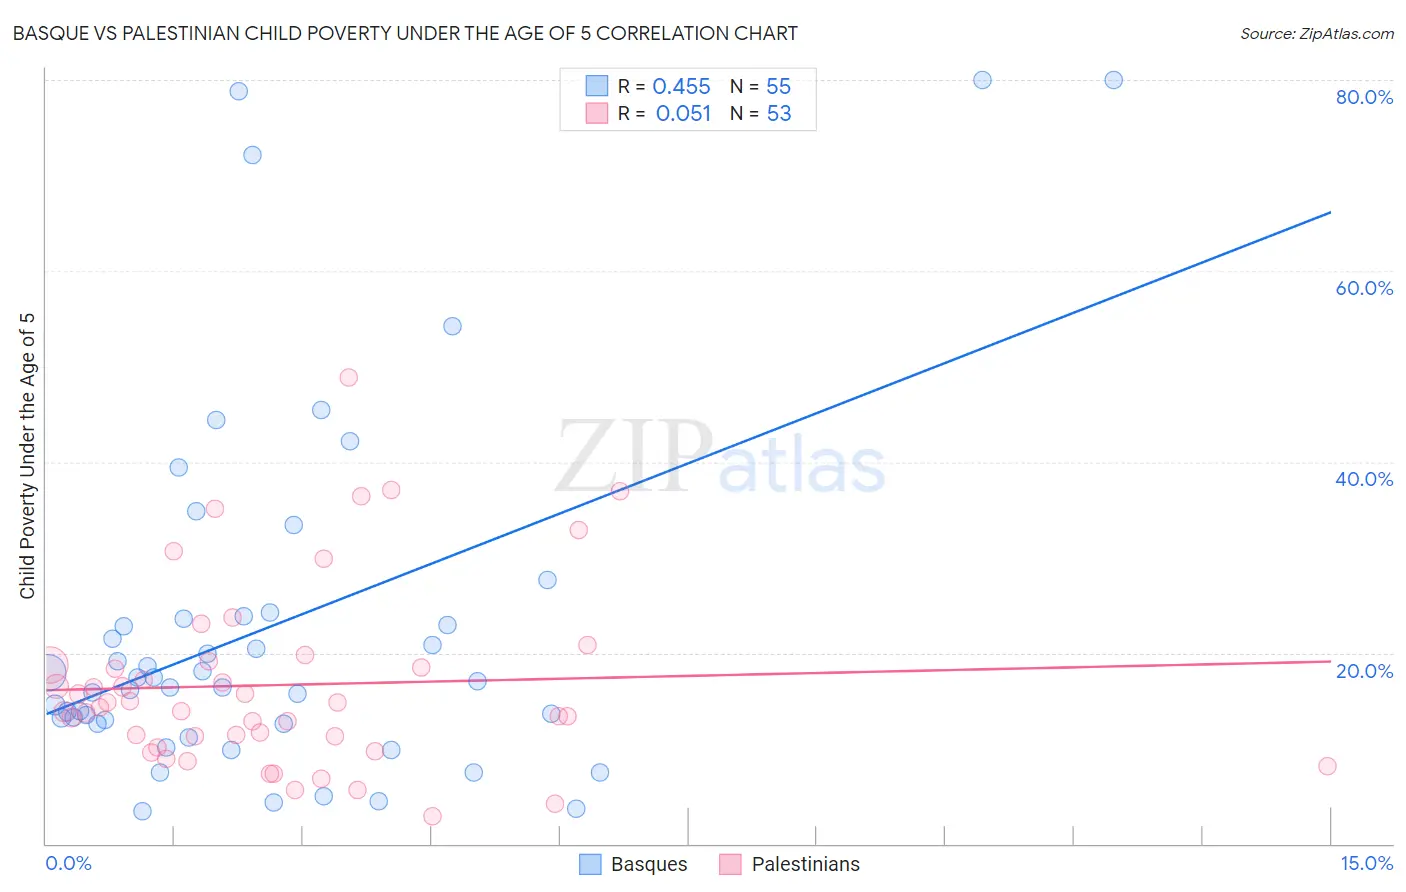
Basque vs Palestinian Child Poverty Under the Age of 5 Correlation Chart
The statistical analysis conducted on geographies consisting of 162,359,571 people shows a moderate positive correlation between the proportion of Basques and poverty level among children under the age of 5 in the United States with a correlation coefficient (R) of 0.455 and weighted average of 16.0%. Similarly, the statistical analysis conducted on geographies consisting of 211,703,351 people shows a slight positive correlation between the proportion of Palestinians and poverty level among children under the age of 5 in the United States with a correlation coefficient (R) of 0.051 and weighted average of 15.8%, a difference of 1.4%.
Child Poverty Under the Age of 5 Correlation Summary
| Measurement | Basque | Palestinian |
| Minimum | 3.4% | 2.9% |
| Maximum | 80.0% | 48.8% |
| Range | 76.6% | 45.9% |
| Mean | 22.8% | 16.6% |
| Median | 17.1% | 14.3% |
| Interquartile 25% (IQ1) | 12.6% | 10.7% |
| Interquartile 75% (IQ3) | 23.8% | 18.9% |
| Interquartile Range (IQR) | 11.2% | 8.3% |
| Standard Deviation (Sample) | 19.0% | 9.6% |
| Standard Deviation (Population) | 18.8% | 9.5% |
Demographics Similar to Basques and Palestinians by Child Poverty Under the Age of 5
In terms of child poverty under the age of 5, the demographic groups most similar to Basques are Immigrants from Denmark (16.0%, a difference of 0.0%), Immigrants from Austria (16.0%, a difference of 0.020%), Albanian (16.0%, a difference of 0.18%), Immigrants from Kuwait (16.0%, a difference of 0.21%), and Peruvian (16.0%, a difference of 0.30%). Similarly, the demographic groups most similar to Palestinians are Immigrants from Canada (15.8%, a difference of 0.010%), Immigrants from Zimbabwe (15.8%, a difference of 0.020%), Immigrants from South Africa (15.8%, a difference of 0.11%), Armenian (15.8%, a difference of 0.15%), and European (15.9%, a difference of 0.43%).
| Demographics | Rating | Rank | Child Poverty Under the Age of 5 |
| Immigrants | South Africa | 96.1 /100 | #98 | Exceptional 15.8% |
| Palestinians | 95.9 /100 | #99 | Exceptional 15.8% |
| Immigrants | Canada | 95.9 /100 | #100 | Exceptional 15.8% |
| Immigrants | Zimbabwe | 95.9 /100 | #101 | Exceptional 15.8% |
| Armenians | 95.7 /100 | #102 | Exceptional 15.8% |
| Europeans | 95.3 /100 | #103 | Exceptional 15.9% |
| Immigrants | North America | 94.9 /100 | #104 | Exceptional 15.9% |
| Immigrants | Spain | 94.8 /100 | #105 | Exceptional 15.9% |
| Tlingit-Haida | 94.7 /100 | #106 | Exceptional 15.9% |
| Slovenes | 94.4 /100 | #107 | Exceptional 16.0% |
| Immigrants | Brazil | 94.4 /100 | #108 | Exceptional 16.0% |
| Northern Europeans | 94.3 /100 | #109 | Exceptional 16.0% |
| Romanians | 94.3 /100 | #110 | Exceptional 16.0% |
| Pakistanis | 94.2 /100 | #111 | Exceptional 16.0% |
| Peruvians | 94.1 /100 | #112 | Exceptional 16.0% |
| Puget Sound Salish | 94.1 /100 | #113 | Exceptional 16.0% |
| Immigrants | Kuwait | 93.9 /100 | #114 | Exceptional 16.0% |
| Albanians | 93.8 /100 | #115 | Exceptional 16.0% |
| Immigrants | Austria | 93.5 /100 | #116 | Exceptional 16.0% |
| Basques | 93.4 /100 | #117 | Exceptional 16.0% |
| Immigrants | Denmark | 93.4 /100 | #118 | Exceptional 16.0% |