Immigrants from Norway vs Palestinian Child Poverty Under the Age of 5
COMPARE
Immigrants from Norway
Palestinian
Child Poverty Under the Age of 5
Child Poverty Under the Age of 5 Comparison
Immigrants from Norway
Palestinians
16.3%
CHILD POVERTY UNDER THE AGE OF 5
89.3/ 100
METRIC RATING
130th/ 347
METRIC RANK
15.8%
CHILD POVERTY UNDER THE AGE OF 5
95.9/ 100
METRIC RATING
99th/ 347
METRIC RANK
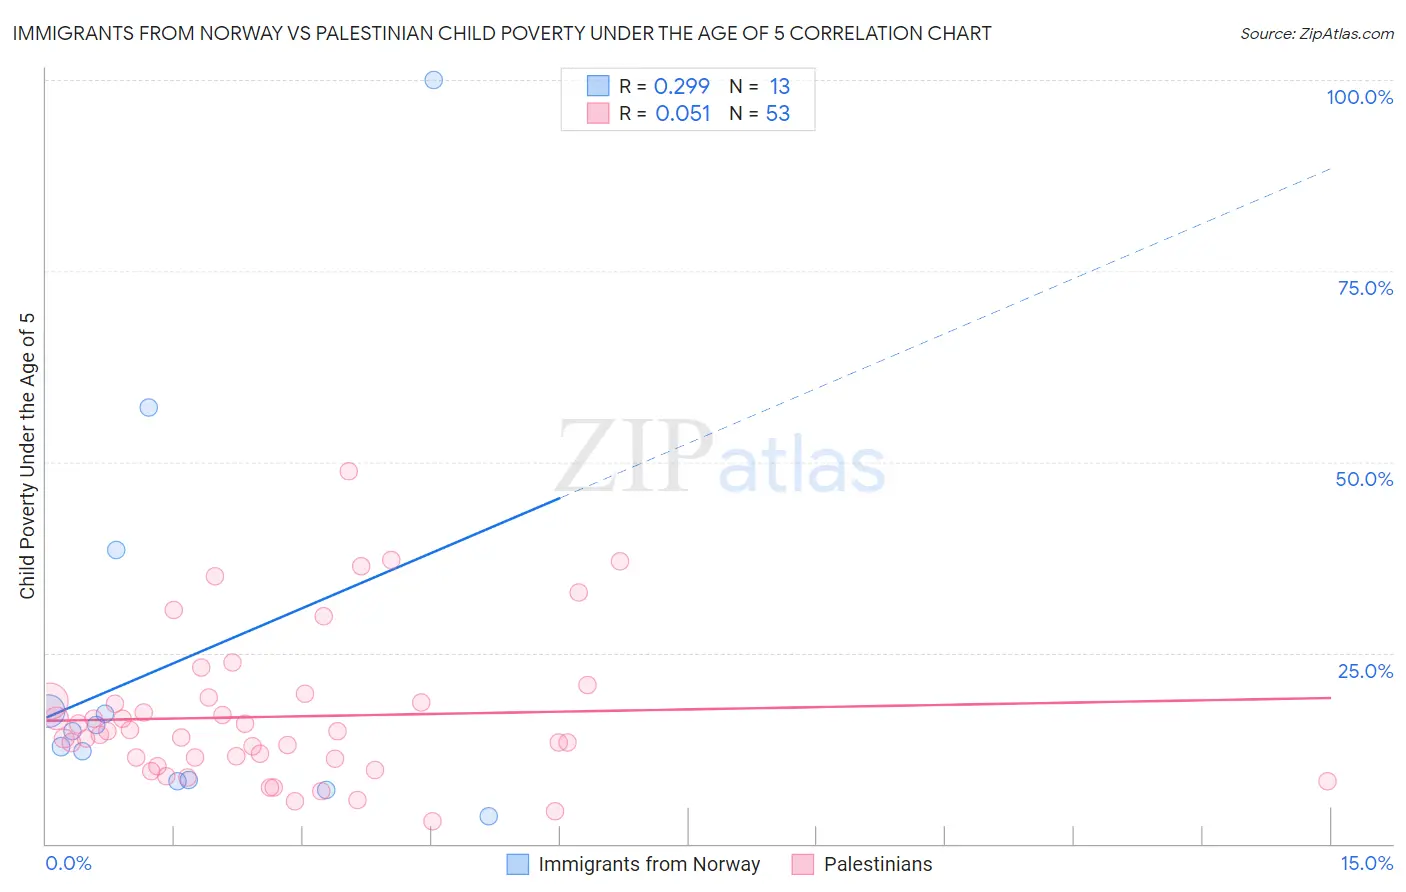
Immigrants from Norway vs Palestinian Child Poverty Under the Age of 5 Correlation Chart
The statistical analysis conducted on geographies consisting of 114,119,932 people shows a weak positive correlation between the proportion of Immigrants from Norway and poverty level among children under the age of 5 in the United States with a correlation coefficient (R) of 0.299 and weighted average of 16.3%. Similarly, the statistical analysis conducted on geographies consisting of 211,703,351 people shows a slight positive correlation between the proportion of Palestinians and poverty level among children under the age of 5 in the United States with a correlation coefficient (R) of 0.051 and weighted average of 15.8%, a difference of 2.9%.
Child Poverty Under the Age of 5 Correlation Summary
| Measurement | Immigrants from Norway | Palestinian |
| Minimum | 3.6% | 2.9% |
| Maximum | 100.0% | 48.8% |
| Range | 96.4% | 45.9% |
| Mean | 24.0% | 16.6% |
| Median | 14.7% | 14.3% |
| Interquartile 25% (IQ1) | 8.3% | 10.7% |
| Interquartile 75% (IQ3) | 27.9% | 18.9% |
| Interquartile Range (IQR) | 19.6% | 8.3% |
| Standard Deviation (Sample) | 27.1% | 9.6% |
| Standard Deviation (Population) | 26.0% | 9.5% |
Similar Demographics by Child Poverty Under the Age of 5
Demographics Similar to Immigrants from Norway by Child Poverty Under the Age of 5
In terms of child poverty under the age of 5, the demographic groups most similar to Immigrants from Norway are British (16.3%, a difference of 0.030%), South African (16.2%, a difference of 0.21%), Finnish (16.3%, a difference of 0.29%), Serbian (16.3%, a difference of 0.32%), and Icelander (16.3%, a difference of 0.39%).
| Demographics | Rating | Rank | Child Poverty Under the Age of 5 |
| Austrians | 92.0 /100 | #123 | Exceptional 16.1% |
| Swiss | 92.0 /100 | #124 | Exceptional 16.1% |
| Native Hawaiians | 91.8 /100 | #125 | Exceptional 16.2% |
| Immigrants | Albania | 91.8 /100 | #126 | Exceptional 16.2% |
| Immigrants | England | 91.5 /100 | #127 | Exceptional 16.2% |
| South Africans | 90.1 /100 | #128 | Exceptional 16.2% |
| British | 89.4 /100 | #129 | Excellent 16.3% |
| Immigrants | Norway | 89.3 /100 | #130 | Excellent 16.3% |
| Finns | 88.3 /100 | #131 | Excellent 16.3% |
| Serbians | 88.2 /100 | #132 | Excellent 16.3% |
| Icelanders | 87.9 /100 | #133 | Excellent 16.3% |
| Immigrants | North Macedonia | 87.8 /100 | #134 | Excellent 16.4% |
| Brazilians | 87.8 /100 | #135 | Excellent 16.4% |
| Immigrants | Northern Africa | 87.5 /100 | #136 | Excellent 16.4% |
| Immigrants | Chile | 85.3 /100 | #137 | Excellent 16.4% |
Demographics Similar to Palestinians by Child Poverty Under the Age of 5
In terms of child poverty under the age of 5, the demographic groups most similar to Palestinians are Immigrants from Canada (15.8%, a difference of 0.010%), Immigrants from Zimbabwe (15.8%, a difference of 0.020%), Immigrants from South Africa (15.8%, a difference of 0.11%), Armenian (15.8%, a difference of 0.15%), and Macedonian (15.8%, a difference of 0.18%).
| Demographics | Rating | Rank | Child Poverty Under the Age of 5 |
| Scandinavians | 97.1 /100 | #92 | Exceptional 15.7% |
| Ukrainians | 97.1 /100 | #93 | Exceptional 15.7% |
| Immigrants | South Eastern Asia | 97.1 /100 | #94 | Exceptional 15.7% |
| Immigrants | Switzerland | 96.4 /100 | #95 | Exceptional 15.8% |
| Immigrants | Kazakhstan | 96.2 /100 | #96 | Exceptional 15.8% |
| Macedonians | 96.2 /100 | #97 | Exceptional 15.8% |
| Immigrants | South Africa | 96.1 /100 | #98 | Exceptional 15.8% |
| Palestinians | 95.9 /100 | #99 | Exceptional 15.8% |
| Immigrants | Canada | 95.9 /100 | #100 | Exceptional 15.8% |
| Immigrants | Zimbabwe | 95.9 /100 | #101 | Exceptional 15.8% |
| Armenians | 95.7 /100 | #102 | Exceptional 15.8% |
| Europeans | 95.3 /100 | #103 | Exceptional 15.9% |
| Immigrants | North America | 94.9 /100 | #104 | Exceptional 15.9% |
| Immigrants | Spain | 94.8 /100 | #105 | Exceptional 15.9% |
| Tlingit-Haida | 94.7 /100 | #106 | Exceptional 15.9% |