Spanish American Indian vs Albanian Single Father Poverty
COMPARE
Spanish American Indian
Albanian
Single Father Poverty
Single Father Poverty Comparison
Spanish American Indians
Albanians
14.4%
SINGLE FATHER POVERTY
100.0/ 100
METRIC RATING
26th/ 347
METRIC RANK
17.2%
SINGLE FATHER POVERTY
0.7/ 100
METRIC RATING
258th/ 347
METRIC RANK
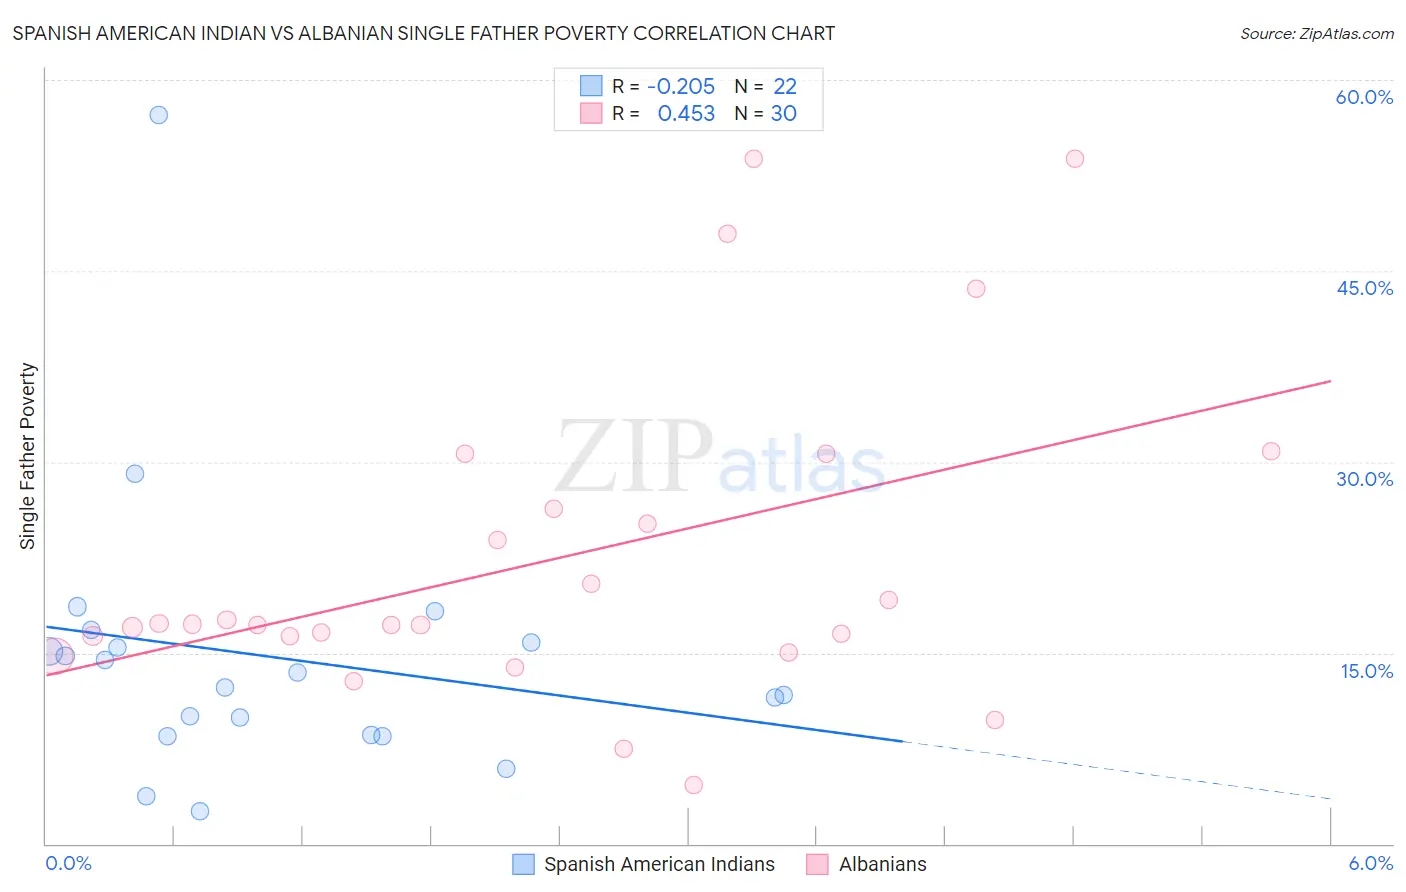
Spanish American Indian vs Albanian Single Father Poverty Correlation Chart
The statistical analysis conducted on geographies consisting of 69,773,093 people shows a weak negative correlation between the proportion of Spanish American Indians and poverty level among single fathers in the United States with a correlation coefficient (R) of -0.205 and weighted average of 14.4%. Similarly, the statistical analysis conducted on geographies consisting of 159,395,060 people shows a moderate positive correlation between the proportion of Albanians and poverty level among single fathers in the United States with a correlation coefficient (R) of 0.453 and weighted average of 17.2%, a difference of 19.2%.
Single Father Poverty Correlation Summary
| Measurement | Spanish American Indian | Albanian |
| Minimum | 2.6% | 4.7% |
| Maximum | 57.2% | 53.8% |
| Range | 54.6% | 49.2% |
| Mean | 14.6% | 22.4% |
| Median | 12.9% | 17.2% |
| Interquartile 25% (IQ1) | 8.5% | 16.3% |
| Interquartile 75% (IQ3) | 15.8% | 26.4% |
| Interquartile Range (IQR) | 7.3% | 10.1% |
| Standard Deviation (Sample) | 11.1% | 12.6% |
| Standard Deviation (Population) | 10.8% | 12.4% |
Similar Demographics by Single Father Poverty
Demographics Similar to Spanish American Indians by Single Father Poverty
In terms of single father poverty, the demographic groups most similar to Spanish American Indians are Nepalese (14.4%, a difference of 0.050%), Iranian (14.4%, a difference of 0.42%), Immigrants from Egypt (14.4%, a difference of 0.46%), Immigrants from South Eastern Asia (14.4%, a difference of 0.46%), and Immigrants from South Central Asia (14.5%, a difference of 0.58%).
| Demographics | Rating | Rank | Single Father Poverty |
| Immigrants | Iraq | 100.0 /100 | #19 | Exceptional 14.3% |
| Immigrants | Singapore | 100.0 /100 | #20 | Exceptional 14.3% |
| Immigrants | Afghanistan | 100.0 /100 | #21 | Exceptional 14.3% |
| Taiwanese | 100.0 /100 | #22 | Exceptional 14.3% |
| Immigrants | Egypt | 100.0 /100 | #23 | Exceptional 14.4% |
| Immigrants | South Eastern Asia | 100.0 /100 | #24 | Exceptional 14.4% |
| Iranians | 100.0 /100 | #25 | Exceptional 14.4% |
| Spanish American Indians | 100.0 /100 | #26 | Exceptional 14.4% |
| Nepalese | 100.0 /100 | #27 | Exceptional 14.4% |
| Immigrants | South Central Asia | 100.0 /100 | #28 | Exceptional 14.5% |
| Somalis | 100.0 /100 | #29 | Exceptional 14.5% |
| Thais | 100.0 /100 | #30 | Exceptional 14.5% |
| Icelanders | 100.0 /100 | #31 | Exceptional 14.5% |
| Asians | 100.0 /100 | #32 | Exceptional 14.6% |
| Okinawans | 100.0 /100 | #33 | Exceptional 14.6% |
Demographics Similar to Albanians by Single Father Poverty
In terms of single father poverty, the demographic groups most similar to Albanians are Immigrants from Albania (17.2%, a difference of 0.020%), Immigrants from Jamaica (17.2%, a difference of 0.040%), Immigrants from Haiti (17.2%, a difference of 0.10%), Sierra Leonean (17.2%, a difference of 0.11%), and Spaniard (17.2%, a difference of 0.18%).
| Demographics | Rating | Rank | Single Father Poverty |
| Luxembourgers | 1.1 /100 | #251 | Tragic 17.1% |
| Croatians | 1.0 /100 | #252 | Tragic 17.1% |
| Cree | 1.0 /100 | #253 | Tragic 17.1% |
| Immigrants | Honduras | 0.9 /100 | #254 | Tragic 17.1% |
| Sierra Leoneans | 0.8 /100 | #255 | Tragic 17.2% |
| Immigrants | Haiti | 0.8 /100 | #256 | Tragic 17.2% |
| Immigrants | Albania | 0.7 /100 | #257 | Tragic 17.2% |
| Albanians | 0.7 /100 | #258 | Tragic 17.2% |
| Immigrants | Jamaica | 0.7 /100 | #259 | Tragic 17.2% |
| Spaniards | 0.6 /100 | #260 | Tragic 17.2% |
| Swiss | 0.5 /100 | #261 | Tragic 17.3% |
| Immigrants | Zaire | 0.4 /100 | #262 | Tragic 17.3% |
| Lithuanians | 0.4 /100 | #263 | Tragic 17.3% |
| Slovenes | 0.3 /100 | #264 | Tragic 17.3% |
| Poles | 0.3 /100 | #265 | Tragic 17.3% |