Spanish American Indian vs Immigrants from Cuba Single Father Poverty
COMPARE
Spanish American Indian
Immigrants from Cuba
Single Father Poverty
Single Father Poverty Comparison
Spanish American Indians
Immigrants from Cuba
14.4%
SINGLE FATHER POVERTY
100.0/ 100
METRIC RATING
26th/ 347
METRIC RANK
16.4%
SINGLE FATHER POVERTY
41.6/ 100
METRIC RATING
178th/ 347
METRIC RANK
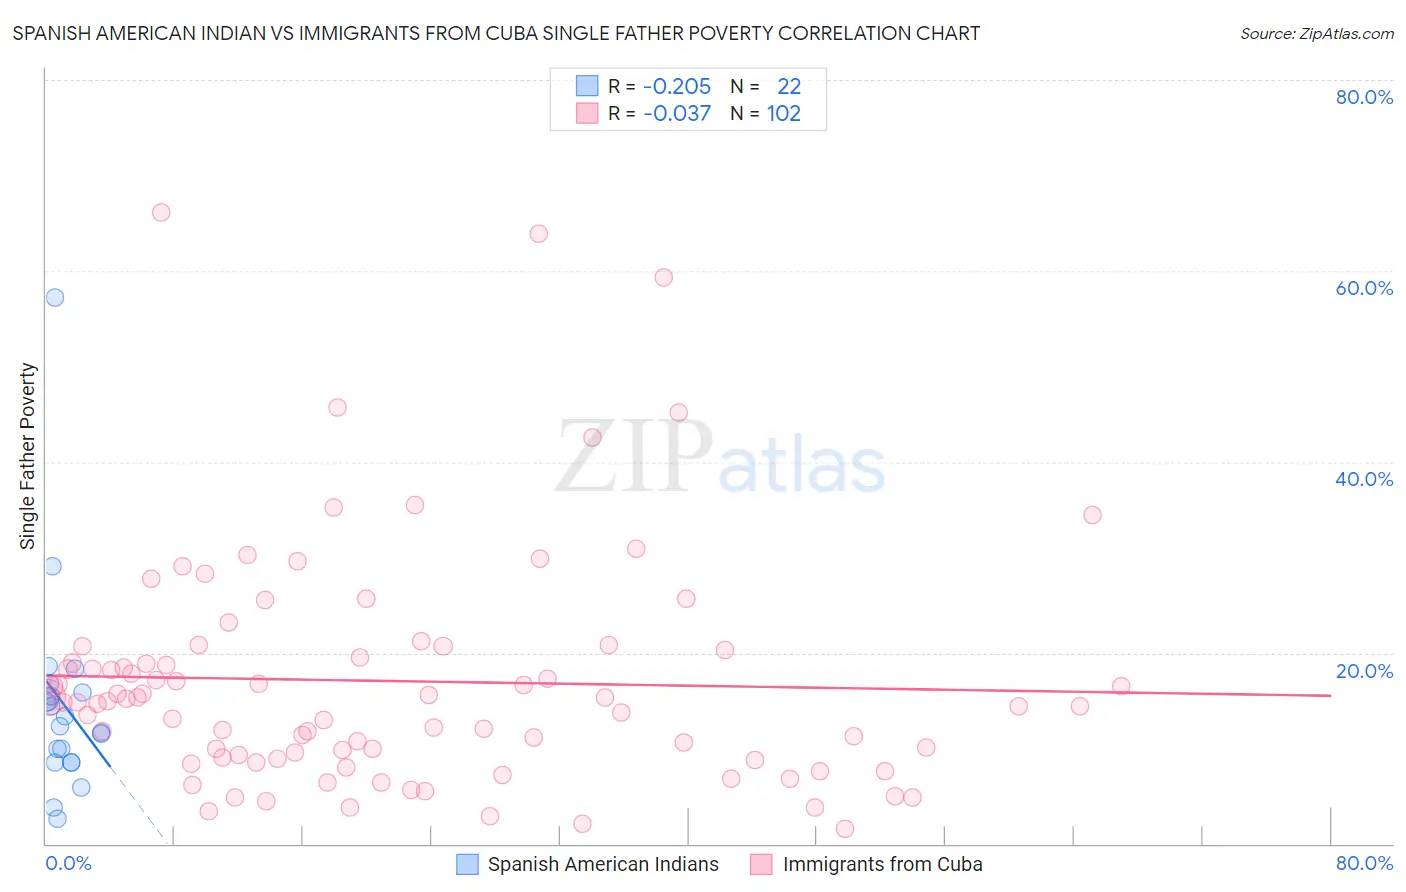
Spanish American Indian vs Immigrants from Cuba Single Father Poverty Correlation Chart
The statistical analysis conducted on geographies consisting of 69,773,093 people shows a weak negative correlation between the proportion of Spanish American Indians and poverty level among single fathers in the United States with a correlation coefficient (R) of -0.205 and weighted average of 14.4%. Similarly, the statistical analysis conducted on geographies consisting of 265,819,511 people shows no correlation between the proportion of Immigrants from Cuba and poverty level among single fathers in the United States with a correlation coefficient (R) of -0.037 and weighted average of 16.4%, a difference of 13.4%.
Single Father Poverty Correlation Summary
| Measurement | Spanish American Indian | Immigrants from Cuba |
| Minimum | 2.6% | 1.6% |
| Maximum | 57.2% | 66.1% |
| Range | 54.6% | 64.5% |
| Mean | 14.6% | 17.0% |
| Median | 12.9% | 14.9% |
| Interquartile 25% (IQ1) | 8.5% | 9.0% |
| Interquartile 75% (IQ3) | 15.8% | 20.3% |
| Interquartile Range (IQR) | 7.3% | 11.3% |
| Standard Deviation (Sample) | 11.1% | 12.2% |
| Standard Deviation (Population) | 10.8% | 12.2% |
Similar Demographics by Single Father Poverty
Demographics Similar to Spanish American Indians by Single Father Poverty
In terms of single father poverty, the demographic groups most similar to Spanish American Indians are Nepalese (14.4%, a difference of 0.050%), Iranian (14.4%, a difference of 0.42%), Immigrants from Egypt (14.4%, a difference of 0.46%), Immigrants from South Eastern Asia (14.4%, a difference of 0.46%), and Immigrants from South Central Asia (14.5%, a difference of 0.58%).
| Demographics | Rating | Rank | Single Father Poverty |
| Immigrants | Iraq | 100.0 /100 | #19 | Exceptional 14.3% |
| Immigrants | Singapore | 100.0 /100 | #20 | Exceptional 14.3% |
| Immigrants | Afghanistan | 100.0 /100 | #21 | Exceptional 14.3% |
| Taiwanese | 100.0 /100 | #22 | Exceptional 14.3% |
| Immigrants | Egypt | 100.0 /100 | #23 | Exceptional 14.4% |
| Immigrants | South Eastern Asia | 100.0 /100 | #24 | Exceptional 14.4% |
| Iranians | 100.0 /100 | #25 | Exceptional 14.4% |
| Spanish American Indians | 100.0 /100 | #26 | Exceptional 14.4% |
| Nepalese | 100.0 /100 | #27 | Exceptional 14.4% |
| Immigrants | South Central Asia | 100.0 /100 | #28 | Exceptional 14.5% |
| Somalis | 100.0 /100 | #29 | Exceptional 14.5% |
| Thais | 100.0 /100 | #30 | Exceptional 14.5% |
| Icelanders | 100.0 /100 | #31 | Exceptional 14.5% |
| Asians | 100.0 /100 | #32 | Exceptional 14.6% |
| Okinawans | 100.0 /100 | #33 | Exceptional 14.6% |
Demographics Similar to Immigrants from Cuba by Single Father Poverty
In terms of single father poverty, the demographic groups most similar to Immigrants from Cuba are Serbian (16.4%, a difference of 0.030%), Immigrants from South Africa (16.3%, a difference of 0.12%), Immigrants from Latin America (16.4%, a difference of 0.20%), Immigrants from Western Africa (16.4%, a difference of 0.26%), and Immigrants from Italy (16.4%, a difference of 0.27%).
| Demographics | Rating | Rank | Single Father Poverty |
| Immigrants | Morocco | 50.7 /100 | #171 | Average 16.3% |
| Immigrants | Sierra Leone | 50.1 /100 | #172 | Average 16.3% |
| Immigrants | St. Vincent and the Grenadines | 50.0 /100 | #173 | Average 16.3% |
| Swedes | 50.0 /100 | #174 | Average 16.3% |
| Immigrants | Ecuador | 49.7 /100 | #175 | Average 16.3% |
| Vietnamese | 48.0 /100 | #176 | Average 16.3% |
| Immigrants | South Africa | 44.2 /100 | #177 | Average 16.3% |
| Immigrants | Cuba | 41.6 /100 | #178 | Average 16.4% |
| Serbians | 40.9 /100 | #179 | Average 16.4% |
| Immigrants | Latin America | 37.2 /100 | #180 | Fair 16.4% |
| Immigrants | Western Africa | 36.0 /100 | #181 | Fair 16.4% |
| Immigrants | Italy | 35.7 /100 | #182 | Fair 16.4% |
| Aleuts | 35.3 /100 | #183 | Fair 16.4% |
| Cambodians | 34.6 /100 | #184 | Fair 16.4% |
| Panamanians | 33.6 /100 | #185 | Fair 16.4% |