Immigrants from Dominican Republic vs Belgian Poverty
COMPARE
Immigrants from Dominican Republic
Belgian
Poverty
Poverty Comparison
Immigrants from Dominican Republic
Belgians
17.8%
POVERTY
0.0/ 100
METRIC RATING
331st/ 347
METRIC RANK
11.4%
POVERTY
95.8/ 100
METRIC RATING
88th/ 347
METRIC RANK
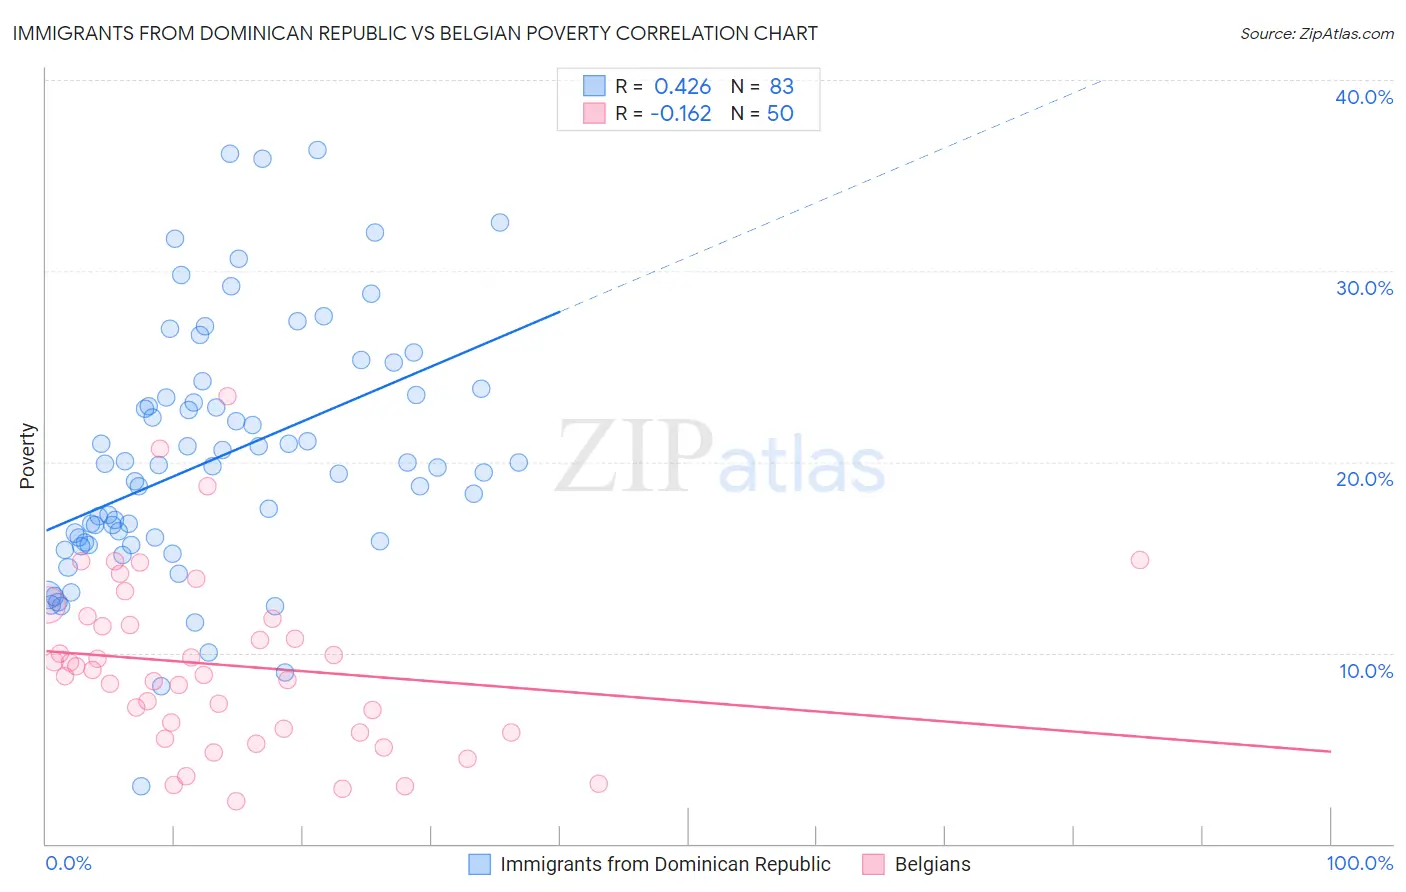
Immigrants from Dominican Republic vs Belgian Poverty Correlation Chart
The statistical analysis conducted on geographies consisting of 274,963,849 people shows a moderate positive correlation between the proportion of Immigrants from Dominican Republic and poverty level in the United States with a correlation coefficient (R) of 0.426 and weighted average of 17.8%. Similarly, the statistical analysis conducted on geographies consisting of 355,864,059 people shows a poor negative correlation between the proportion of Belgians and poverty level in the United States with a correlation coefficient (R) of -0.162 and weighted average of 11.4%, a difference of 56.4%.
Poverty Correlation Summary
| Measurement | Immigrants from Dominican Republic | Belgian |
| Minimum | 3.0% | 2.2% |
| Maximum | 36.4% | 23.4% |
| Range | 33.4% | 21.2% |
| Mean | 20.2% | 9.4% |
| Median | 19.8% | 9.0% |
| Interquartile 25% (IQ1) | 15.8% | 5.8% |
| Interquartile 75% (IQ3) | 23.5% | 11.8% |
| Interquartile Range (IQR) | 7.7% | 5.9% |
| Standard Deviation (Sample) | 6.5% | 4.6% |
| Standard Deviation (Population) | 6.5% | 4.5% |
Similar Demographics by Poverty
Demographics Similar to Immigrants from Dominican Republic by Poverty
In terms of poverty, the demographic groups most similar to Immigrants from Dominican Republic are Dominican (17.6%, a difference of 0.92%), Native/Alaskan (18.1%, a difference of 1.4%), Black/African American (17.3%, a difference of 3.2%), Houma (18.4%, a difference of 3.5%), and Apache (18.4%, a difference of 3.5%).
| Demographics | Rating | Rank | Poverty |
| Yakama | 0.0 /100 | #324 | Tragic 16.7% |
| Central American Indians | 0.0 /100 | #325 | Tragic 16.7% |
| Paiute | 0.0 /100 | #326 | Tragic 16.7% |
| Kiowa | 0.0 /100 | #327 | Tragic 16.8% |
| Ute | 0.0 /100 | #328 | Tragic 16.9% |
| Blacks/African Americans | 0.0 /100 | #329 | Tragic 17.3% |
| Dominicans | 0.0 /100 | #330 | Tragic 17.6% |
| Immigrants | Dominican Republic | 0.0 /100 | #331 | Tragic 17.8% |
| Natives/Alaskans | 0.0 /100 | #332 | Tragic 18.1% |
| Houma | 0.0 /100 | #333 | Tragic 18.4% |
| Apache | 0.0 /100 | #334 | Tragic 18.4% |
| Cheyenne | 0.0 /100 | #335 | Tragic 18.9% |
| Pueblo | 0.0 /100 | #336 | Tragic 19.4% |
| Sioux | 0.0 /100 | #337 | Tragic 19.8% |
| Yuman | 0.0 /100 | #338 | Tragic 20.2% |
Demographics Similar to Belgians by Poverty
In terms of poverty, the demographic groups most similar to Belgians are Czechoslovakian (11.4%, a difference of 0.040%), Jordanian (11.4%, a difference of 0.14%), Northern European (11.4%, a difference of 0.14%), Immigrants from Denmark (11.4%, a difference of 0.20%), and Immigrants from England (11.4%, a difference of 0.26%).
| Demographics | Rating | Rank | Poverty |
| Irish | 96.6 /100 | #81 | Exceptional 11.3% |
| Egyptians | 96.5 /100 | #82 | Exceptional 11.3% |
| Immigrants | Sweden | 96.3 /100 | #83 | Exceptional 11.3% |
| English | 96.3 /100 | #84 | Exceptional 11.3% |
| Immigrants | England | 96.2 /100 | #85 | Exceptional 11.4% |
| Jordanians | 96.0 /100 | #86 | Exceptional 11.4% |
| Northern Europeans | 96.0 /100 | #87 | Exceptional 11.4% |
| Belgians | 95.8 /100 | #88 | Exceptional 11.4% |
| Czechoslovakians | 95.7 /100 | #89 | Exceptional 11.4% |
| Immigrants | Denmark | 95.5 /100 | #90 | Exceptional 11.4% |
| Finns | 95.2 /100 | #91 | Exceptional 11.4% |
| British | 95.0 /100 | #92 | Exceptional 11.4% |
| Romanians | 94.9 /100 | #93 | Exceptional 11.4% |
| Paraguayans | 94.9 /100 | #94 | Exceptional 11.4% |
| Australians | 94.9 /100 | #95 | Exceptional 11.4% |