Spaniard vs Navajo Poverty
COMPARE
Spaniard
Navajo
Poverty
Poverty Comparison
Spaniards
Navajo
12.8%
POVERTY
16.5/ 100
METRIC RATING
200th/ 347
METRIC RANK
23.1%
POVERTY
0.0/ 100
METRIC RATING
345th/ 347
METRIC RANK
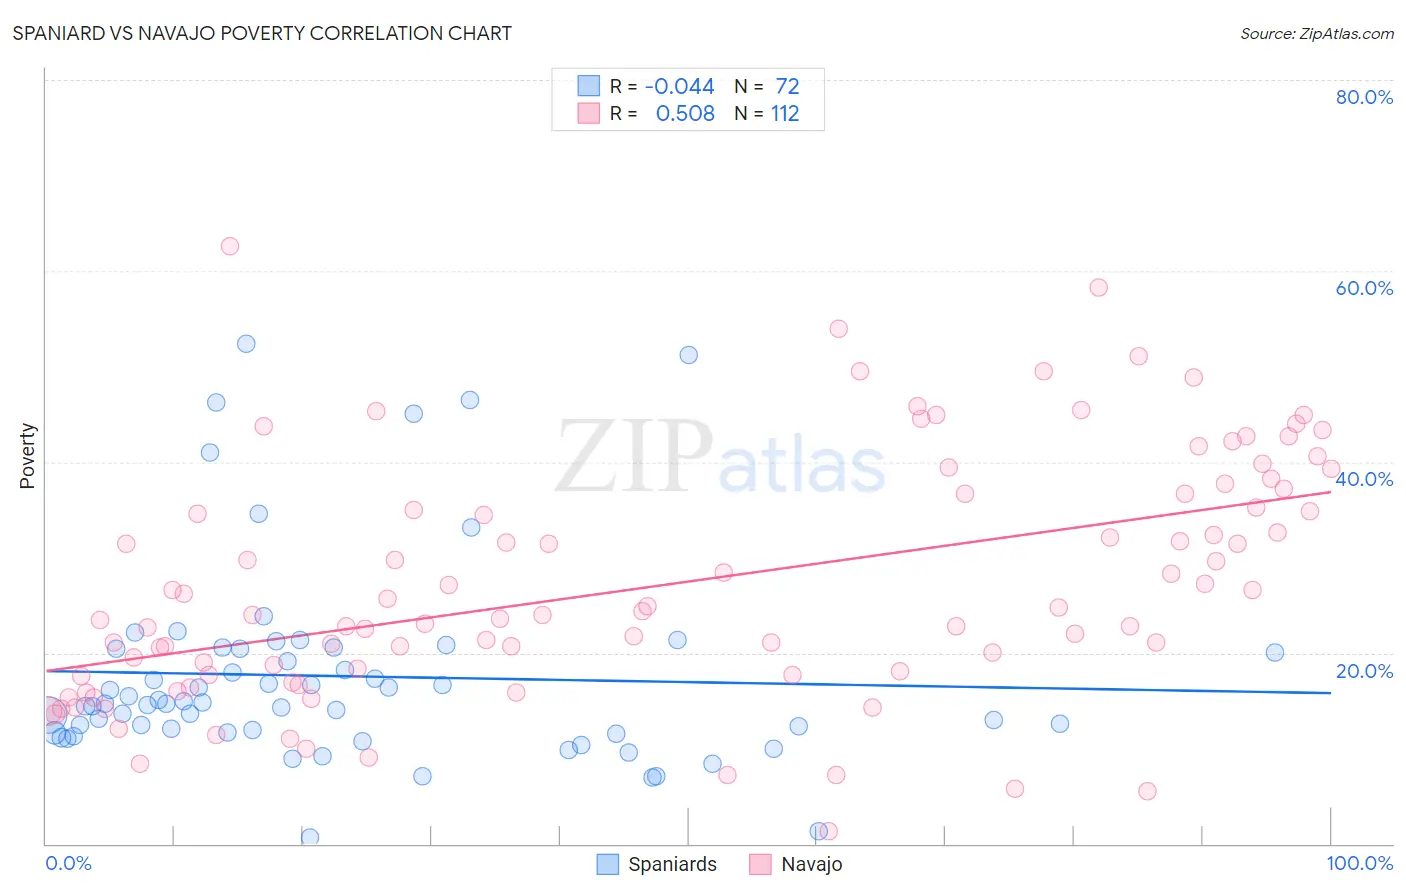
Spaniard vs Navajo Poverty Correlation Chart
The statistical analysis conducted on geographies consisting of 443,194,534 people shows no correlation between the proportion of Spaniards and poverty level in the United States with a correlation coefficient (R) of -0.044 and weighted average of 12.8%. Similarly, the statistical analysis conducted on geographies consisting of 224,751,709 people shows a substantial positive correlation between the proportion of Navajo and poverty level in the United States with a correlation coefficient (R) of 0.508 and weighted average of 23.1%, a difference of 80.3%.
Poverty Correlation Summary
| Measurement | Spaniard | Navajo |
| Minimum | 0.64% | 1.3% |
| Maximum | 52.4% | 62.6% |
| Range | 51.7% | 61.2% |
| Mean | 17.5% | 27.2% |
| Median | 14.7% | 24.2% |
| Interquartile 25% (IQ1) | 11.7% | 17.7% |
| Interquartile 75% (IQ3) | 20.5% | 36.7% |
| Interquartile Range (IQR) | 8.8% | 19.1% |
| Standard Deviation (Sample) | 10.6% | 12.7% |
| Standard Deviation (Population) | 10.5% | 12.6% |
Similar Demographics by Poverty
Demographics Similar to Spaniards by Poverty
In terms of poverty, the demographic groups most similar to Spaniards are Immigrants from Uganda (12.8%, a difference of 0.0%), Immigrants from Kenya (12.8%, a difference of 0.16%), Immigrants from Uruguay (12.8%, a difference of 0.16%), Hmong (12.8%, a difference of 0.27%), and Immigrants from Lebanon (12.8%, a difference of 0.35%).
| Demographics | Rating | Rank | Poverty |
| Delaware | 21.4 /100 | #193 | Fair 12.7% |
| Arabs | 21.1 /100 | #194 | Fair 12.7% |
| Immigrants | Kuwait | 20.9 /100 | #195 | Fair 12.7% |
| Iraqis | 20.8 /100 | #196 | Fair 12.7% |
| Immigrants | Lebanon | 18.7 /100 | #197 | Poor 12.8% |
| Spanish | 18.7 /100 | #198 | Poor 12.8% |
| Immigrants | Kenya | 17.5 /100 | #199 | Poor 12.8% |
| Spaniards | 16.5 /100 | #200 | Poor 12.8% |
| Immigrants | Uganda | 16.5 /100 | #201 | Poor 12.8% |
| Immigrants | Uruguay | 15.6 /100 | #202 | Poor 12.8% |
| Hmong | 15.0 /100 | #203 | Poor 12.8% |
| Immigrants | Western Asia | 14.1 /100 | #204 | Poor 12.9% |
| Tsimshian | 9.2 /100 | #205 | Tragic 13.0% |
| Immigrants | Eastern Africa | 7.0 /100 | #206 | Tragic 13.1% |
| Panamanians | 6.6 /100 | #207 | Tragic 13.1% |
Demographics Similar to Navajo by Poverty
In terms of poverty, the demographic groups most similar to Navajo are Puerto Rican (23.7%, a difference of 2.5%), Lumbee (21.9%, a difference of 5.4%), Pima (21.9%, a difference of 5.6%), Tohono O'odham (24.4%, a difference of 5.7%), and Immigrants from Yemen (21.5%, a difference of 7.3%).
| Demographics | Rating | Rank | Poverty |
| Houma | 0.0 /100 | #333 | Tragic 18.4% |
| Apache | 0.0 /100 | #334 | Tragic 18.4% |
| Cheyenne | 0.0 /100 | #335 | Tragic 18.9% |
| Pueblo | 0.0 /100 | #336 | Tragic 19.4% |
| Sioux | 0.0 /100 | #337 | Tragic 19.8% |
| Yuman | 0.0 /100 | #338 | Tragic 20.2% |
| Crow | 0.0 /100 | #339 | Tragic 20.7% |
| Yup'ik | 0.0 /100 | #340 | Tragic 20.8% |
| Hopi | 0.0 /100 | #341 | Tragic 20.8% |
| Immigrants | Yemen | 0.0 /100 | #342 | Tragic 21.5% |
| Pima | 0.0 /100 | #343 | Tragic 21.9% |
| Lumbee | 0.0 /100 | #344 | Tragic 21.9% |
| Navajo | 0.0 /100 | #345 | Tragic 23.1% |
| Puerto Ricans | 0.0 /100 | #346 | Tragic 23.7% |
| Tohono O'odham | 0.0 /100 | #347 | Tragic 24.4% |