Soviet Union vs Shoshone Child Poverty Under the Age of 5
COMPARE
Soviet Union
Shoshone
Child Poverty Under the Age of 5
Child Poverty Under the Age of 5 Comparison
Soviet Union
Shoshone
14.7%
CHILD POVERTY UNDER THE AGE OF 5
99.7/ 100
METRIC RATING
42nd/ 347
METRIC RANK
20.0%
CHILD POVERTY UNDER THE AGE OF 5
0.2/ 100
METRIC RATING
257th/ 347
METRIC RANK
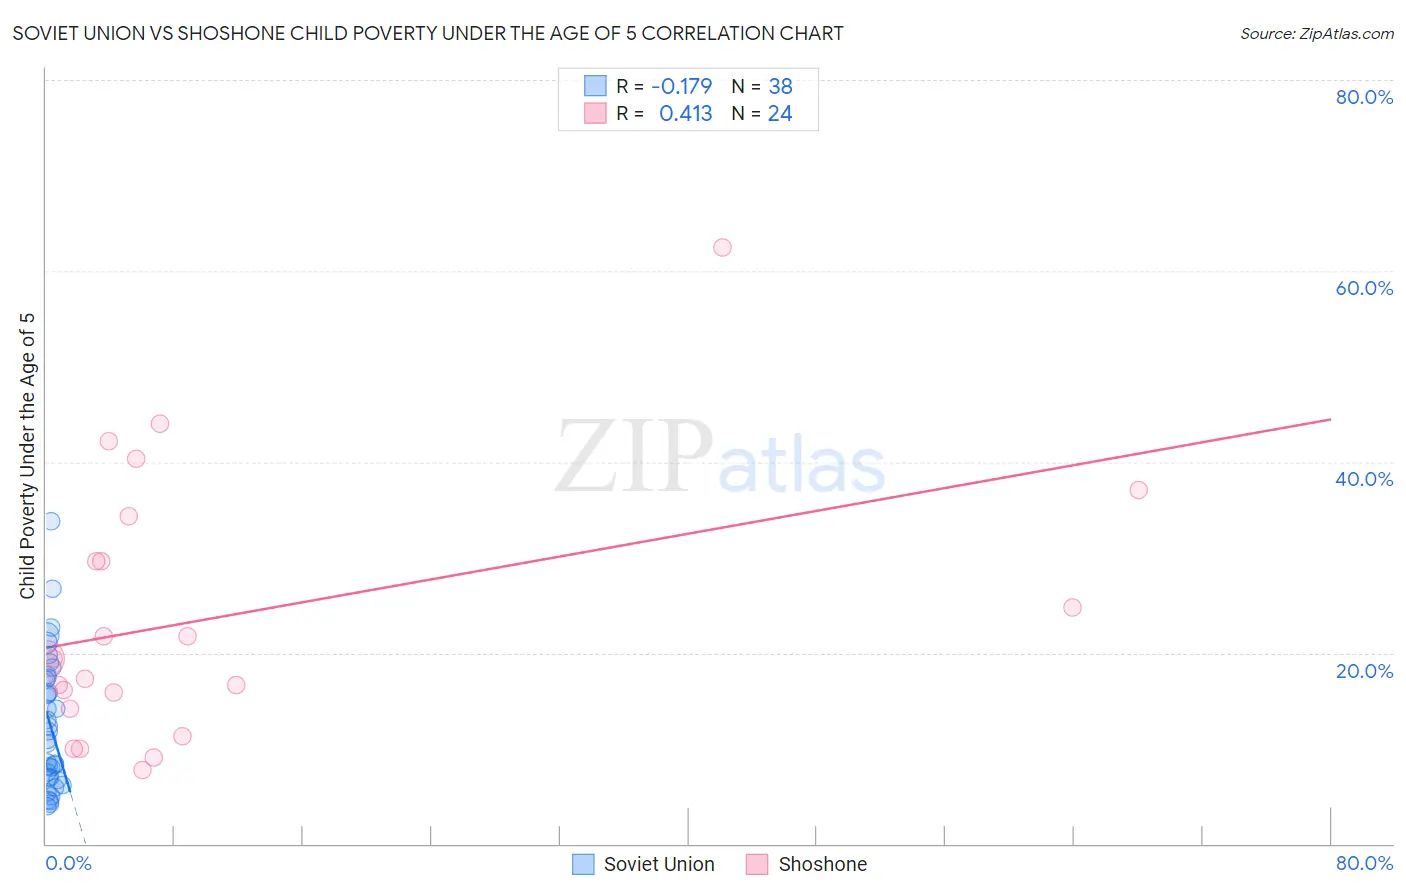
Soviet Union vs Shoshone Child Poverty Under the Age of 5 Correlation Chart
The statistical analysis conducted on geographies consisting of 43,034,712 people shows a poor negative correlation between the proportion of Soviet Union and poverty level among children under the age of 5 in the United States with a correlation coefficient (R) of -0.179 and weighted average of 14.7%. Similarly, the statistical analysis conducted on geographies consisting of 66,129,328 people shows a moderate positive correlation between the proportion of Shoshone and poverty level among children under the age of 5 in the United States with a correlation coefficient (R) of 0.413 and weighted average of 20.0%, a difference of 36.0%.
Child Poverty Under the Age of 5 Correlation Summary
| Measurement | Soviet Union | Shoshone |
| Minimum | 3.9% | 7.7% |
| Maximum | 33.8% | 62.5% |
| Range | 29.9% | 54.8% |
| Mean | 12.6% | 23.8% |
| Median | 11.3% | 19.4% |
| Interquartile 25% (IQ1) | 6.9% | 15.0% |
| Interquartile 75% (IQ3) | 17.4% | 32.0% |
| Interquartile Range (IQR) | 10.5% | 17.0% |
| Standard Deviation (Sample) | 7.0% | 13.7% |
| Standard Deviation (Population) | 7.0% | 13.4% |
Similar Demographics by Child Poverty Under the Age of 5
Demographics Similar to Soviet Union by Child Poverty Under the Age of 5
In terms of child poverty under the age of 5, the demographic groups most similar to Soviet Union are Immigrants from Greece (14.7%, a difference of 0.0%), Immigrants from Philippines (14.7%, a difference of 0.13%), Immigrants from Belarus (14.7%, a difference of 0.16%), Laotian (14.7%, a difference of 0.26%), and Immigrants from Australia (14.6%, a difference of 0.28%).
| Demographics | Rating | Rank | Child Poverty Under the Age of 5 |
| Latvians | 99.8 /100 | #35 | Exceptional 14.5% |
| Maltese | 99.8 /100 | #36 | Exceptional 14.5% |
| Turks | 99.7 /100 | #37 | Exceptional 14.6% |
| Eastern Europeans | 99.7 /100 | #38 | Exceptional 14.6% |
| Norwegians | 99.7 /100 | #39 | Exceptional 14.6% |
| Immigrants | Australia | 99.7 /100 | #40 | Exceptional 14.6% |
| Immigrants | Belarus | 99.7 /100 | #41 | Exceptional 14.7% |
| Soviet Union | 99.7 /100 | #42 | Exceptional 14.7% |
| Immigrants | Greece | 99.7 /100 | #43 | Exceptional 14.7% |
| Immigrants | Philippines | 99.7 /100 | #44 | Exceptional 14.7% |
| Laotians | 99.6 /100 | #45 | Exceptional 14.7% |
| Tsimshian | 99.6 /100 | #46 | Exceptional 14.7% |
| Russians | 99.6 /100 | #47 | Exceptional 14.8% |
| Immigrants | Czechoslovakia | 99.6 /100 | #48 | Exceptional 14.8% |
| Immigrants | Bulgaria | 99.6 /100 | #49 | Exceptional 14.8% |
Demographics Similar to Shoshone by Child Poverty Under the Age of 5
In terms of child poverty under the age of 5, the demographic groups most similar to Shoshone are Immigrants from Barbados (20.0%, a difference of 0.010%), Immigrants from St. Vincent and the Grenadines (20.0%, a difference of 0.14%), Immigrants from El Salvador (20.0%, a difference of 0.16%), Immigrants from Cuba (19.9%, a difference of 0.23%), and Fijian (19.9%, a difference of 0.33%).
| Demographics | Rating | Rank | Child Poverty Under the Age of 5 |
| Immigrants | Nonimmigrants | 0.4 /100 | #250 | Tragic 19.7% |
| Pennsylvania Germans | 0.3 /100 | #251 | Tragic 19.8% |
| Immigrants | Nicaragua | 0.3 /100 | #252 | Tragic 19.8% |
| Mexican American Indians | 0.3 /100 | #253 | Tragic 19.9% |
| Fijians | 0.3 /100 | #254 | Tragic 19.9% |
| Immigrants | Cuba | 0.2 /100 | #255 | Tragic 19.9% |
| Immigrants | Barbados | 0.2 /100 | #256 | Tragic 20.0% |
| Shoshone | 0.2 /100 | #257 | Tragic 20.0% |
| Immigrants | St. Vincent and the Grenadines | 0.2 /100 | #258 | Tragic 20.0% |
| Immigrants | El Salvador | 0.2 /100 | #259 | Tragic 20.0% |
| Spanish Americans | 0.2 /100 | #260 | Tragic 20.1% |
| Immigrants | Bangladesh | 0.2 /100 | #261 | Tragic 20.1% |
| Liberians | 0.1 /100 | #262 | Tragic 20.2% |
| Barbadians | 0.1 /100 | #263 | Tragic 20.2% |
| Immigrants | Liberia | 0.1 /100 | #264 | Tragic 20.2% |