Soviet Union vs Seminole Unemployment Among Women with Children Under 18 years
COMPARE
Soviet Union
Seminole
Unemployment Among Women with Children Under 18 years
Unemployment Among Women with Children Under 18 years Comparison
Soviet Union
Seminole
4.9%
UNEMPLOYMENT AMONG WOMEN WITH CHILDREN UNDER 18 YEARS
99.5/ 100
METRIC RATING
27th/ 347
METRIC RANK
6.0%
UNEMPLOYMENT AMONG WOMEN WITH CHILDREN UNDER 18 YEARS
0.5/ 100
METRIC RATING
252nd/ 347
METRIC RANK
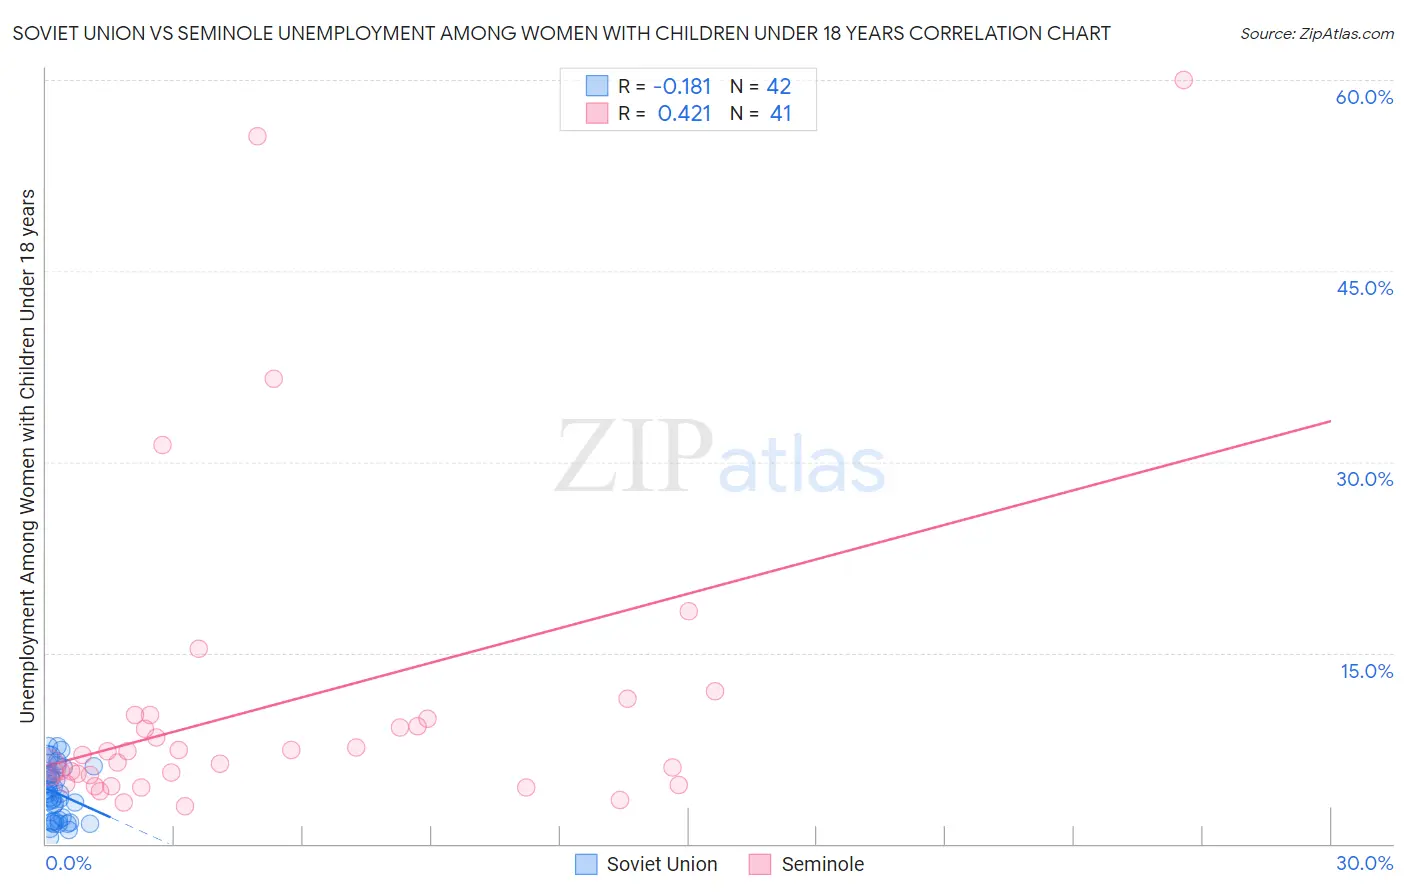
Soviet Union vs Seminole Unemployment Among Women with Children Under 18 years Correlation Chart
The statistical analysis conducted on geographies consisting of 43,276,726 people shows a poor negative correlation between the proportion of Soviet Union and unemployment rate among women with children under the age of 18 in the United States with a correlation coefficient (R) of -0.181 and weighted average of 4.9%. Similarly, the statistical analysis conducted on geographies consisting of 116,531,030 people shows a moderate positive correlation between the proportion of Seminole and unemployment rate among women with children under the age of 18 in the United States with a correlation coefficient (R) of 0.421 and weighted average of 6.0%, a difference of 20.7%.
Unemployment Among Women with Children Under 18 years Correlation Summary
| Measurement | Soviet Union | Seminole |
| Minimum | 0.50% | 3.0% |
| Maximum | 7.7% | 60.0% |
| Range | 7.2% | 57.0% |
| Mean | 4.0% | 11.0% |
| Median | 3.7% | 6.9% |
| Interquartile 25% (IQ1) | 1.8% | 5.1% |
| Interquartile 75% (IQ3) | 5.5% | 9.9% |
| Interquartile Range (IQR) | 3.7% | 4.9% |
| Standard Deviation (Sample) | 2.1% | 12.6% |
| Standard Deviation (Population) | 2.0% | 12.5% |
Similar Demographics by Unemployment Among Women with Children Under 18 years
Demographics Similar to Soviet Union by Unemployment Among Women with Children Under 18 years
In terms of unemployment among women with children under 18 years, the demographic groups most similar to Soviet Union are Swiss (4.9%, a difference of 0.080%), Immigrants from Eastern Asia (4.9%, a difference of 0.16%), Chinese (4.9%, a difference of 0.18%), Belgian (4.9%, a difference of 0.19%), and Finnish (4.9%, a difference of 0.21%).
| Demographics | Rating | Rank | Unemployment Among Women with Children Under 18 years |
| Latvians | 99.7 /100 | #20 | Exceptional 4.9% |
| Europeans | 99.6 /100 | #21 | Exceptional 4.9% |
| Indians (Asian) | 99.6 /100 | #22 | Exceptional 4.9% |
| Immigrants | China | 99.6 /100 | #23 | Exceptional 4.9% |
| Belgians | 99.5 /100 | #24 | Exceptional 4.9% |
| Chinese | 99.5 /100 | #25 | Exceptional 4.9% |
| Swiss | 99.5 /100 | #26 | Exceptional 4.9% |
| Soviet Union | 99.5 /100 | #27 | Exceptional 4.9% |
| Immigrants | Eastern Asia | 99.5 /100 | #28 | Exceptional 4.9% |
| Finns | 99.4 /100 | #29 | Exceptional 4.9% |
| Burmese | 99.4 /100 | #30 | Exceptional 4.9% |
| Cypriots | 99.3 /100 | #31 | Exceptional 5.0% |
| Dutch | 99.3 /100 | #32 | Exceptional 5.0% |
| Croatians | 99.3 /100 | #33 | Exceptional 5.0% |
| Immigrants | South Central Asia | 99.2 /100 | #34 | Exceptional 5.0% |
Demographics Similar to Seminole by Unemployment Among Women with Children Under 18 years
In terms of unemployment among women with children under 18 years, the demographic groups most similar to Seminole are Immigrants from Congo (6.0%, a difference of 0.21%), Ute (5.9%, a difference of 0.62%), Immigrants from Cabo Verde (5.9%, a difference of 0.63%), Immigrants from Cameroon (5.9%, a difference of 0.70%), and Delaware (5.9%, a difference of 0.85%).
| Demographics | Rating | Rank | Unemployment Among Women with Children Under 18 years |
| Ugandans | 1.1 /100 | #245 | Tragic 5.9% |
| Uruguayans | 1.0 /100 | #246 | Tragic 5.9% |
| Cape Verdeans | 1.0 /100 | #247 | Tragic 5.9% |
| Delaware | 0.8 /100 | #248 | Tragic 5.9% |
| Immigrants | Cameroon | 0.8 /100 | #249 | Tragic 5.9% |
| Immigrants | Cabo Verde | 0.7 /100 | #250 | Tragic 5.9% |
| Ute | 0.7 /100 | #251 | Tragic 5.9% |
| Seminole | 0.5 /100 | #252 | Tragic 6.0% |
| Immigrants | Congo | 0.4 /100 | #253 | Tragic 6.0% |
| Immigrants | Azores | 0.3 /100 | #254 | Tragic 6.0% |
| Liberians | 0.2 /100 | #255 | Tragic 6.0% |
| Nepalese | 0.2 /100 | #256 | Tragic 6.0% |
| Bermudans | 0.1 /100 | #257 | Tragic 6.1% |
| Immigrants | Nigeria | 0.1 /100 | #258 | Tragic 6.1% |
| Ottawa | 0.1 /100 | #259 | Tragic 6.1% |