Soviet Union vs Polish Child Poverty Under the Age of 5
COMPARE
Soviet Union
Polish
Child Poverty Under the Age of 5
Child Poverty Under the Age of 5 Comparison
Soviet Union
Poles
14.7%
CHILD POVERTY UNDER THE AGE OF 5
99.7/ 100
METRIC RATING
42nd/ 347
METRIC RANK
15.7%
CHILD POVERTY UNDER THE AGE OF 5
97.2/ 100
METRIC RATING
91st/ 347
METRIC RANK
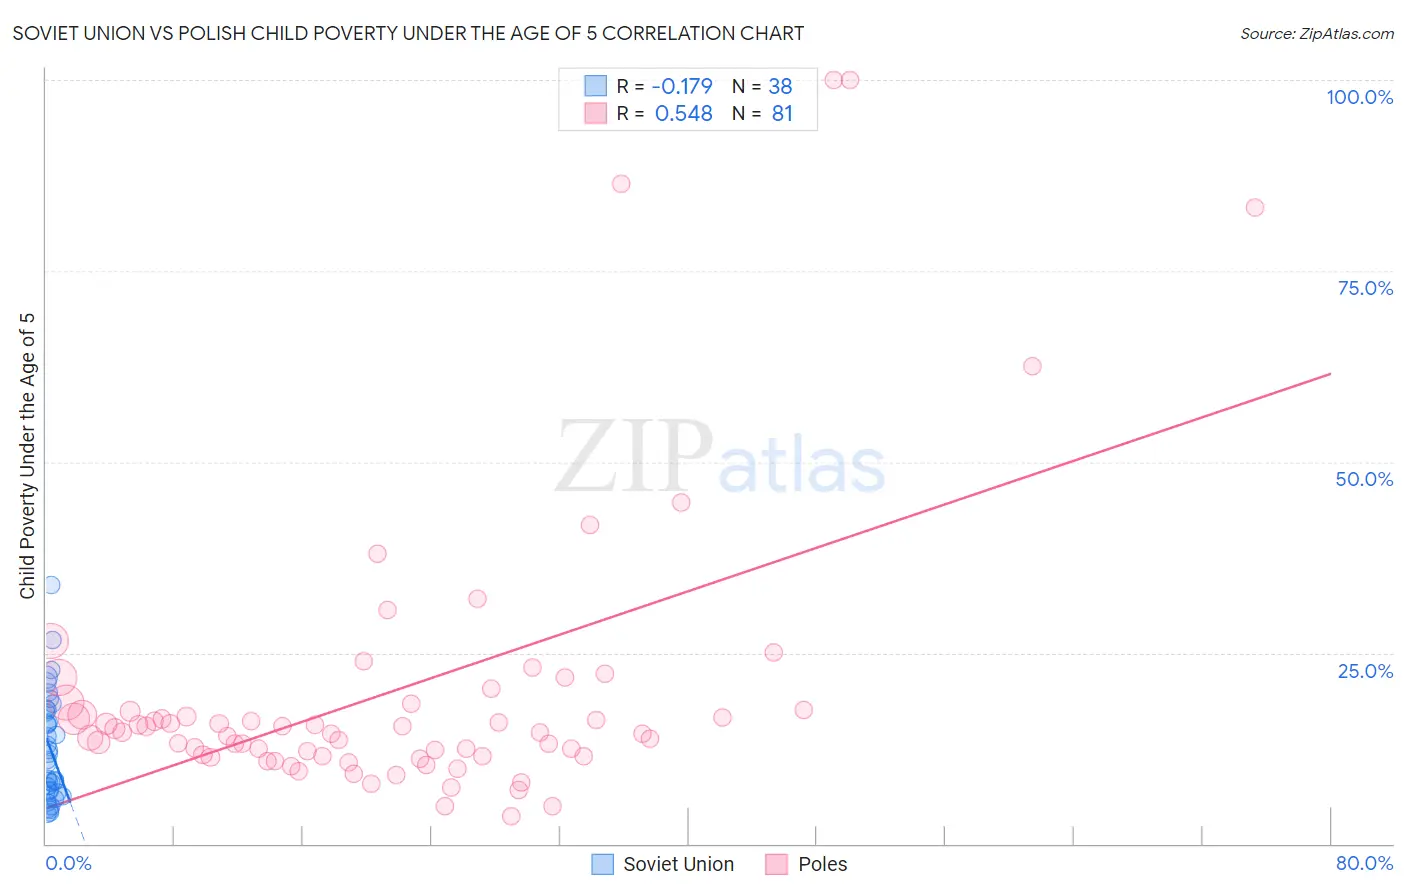
Soviet Union vs Polish Child Poverty Under the Age of 5 Correlation Chart
The statistical analysis conducted on geographies consisting of 43,034,712 people shows a poor negative correlation between the proportion of Soviet Union and poverty level among children under the age of 5 in the United States with a correlation coefficient (R) of -0.179 and weighted average of 14.7%. Similarly, the statistical analysis conducted on geographies consisting of 520,801,927 people shows a substantial positive correlation between the proportion of Poles and poverty level among children under the age of 5 in the United States with a correlation coefficient (R) of 0.548 and weighted average of 15.7%, a difference of 6.6%.
Child Poverty Under the Age of 5 Correlation Summary
| Measurement | Soviet Union | Polish |
| Minimum | 3.9% | 3.7% |
| Maximum | 33.8% | 100.0% |
| Range | 29.9% | 96.3% |
| Mean | 12.6% | 20.0% |
| Median | 11.3% | 14.6% |
| Interquartile 25% (IQ1) | 6.9% | 11.5% |
| Interquartile 75% (IQ3) | 17.4% | 17.9% |
| Interquartile Range (IQR) | 10.5% | 6.4% |
| Standard Deviation (Sample) | 7.0% | 18.9% |
| Standard Deviation (Population) | 7.0% | 18.8% |
Similar Demographics by Child Poverty Under the Age of 5
Demographics Similar to Soviet Union by Child Poverty Under the Age of 5
In terms of child poverty under the age of 5, the demographic groups most similar to Soviet Union are Immigrants from Greece (14.7%, a difference of 0.0%), Immigrants from Philippines (14.7%, a difference of 0.13%), Immigrants from Belarus (14.7%, a difference of 0.16%), Laotian (14.7%, a difference of 0.26%), and Immigrants from Australia (14.6%, a difference of 0.28%).
| Demographics | Rating | Rank | Child Poverty Under the Age of 5 |
| Latvians | 99.8 /100 | #35 | Exceptional 14.5% |
| Maltese | 99.8 /100 | #36 | Exceptional 14.5% |
| Turks | 99.7 /100 | #37 | Exceptional 14.6% |
| Eastern Europeans | 99.7 /100 | #38 | Exceptional 14.6% |
| Norwegians | 99.7 /100 | #39 | Exceptional 14.6% |
| Immigrants | Australia | 99.7 /100 | #40 | Exceptional 14.6% |
| Immigrants | Belarus | 99.7 /100 | #41 | Exceptional 14.7% |
| Soviet Union | 99.7 /100 | #42 | Exceptional 14.7% |
| Immigrants | Greece | 99.7 /100 | #43 | Exceptional 14.7% |
| Immigrants | Philippines | 99.7 /100 | #44 | Exceptional 14.7% |
| Laotians | 99.6 /100 | #45 | Exceptional 14.7% |
| Tsimshian | 99.6 /100 | #46 | Exceptional 14.7% |
| Russians | 99.6 /100 | #47 | Exceptional 14.8% |
| Immigrants | Czechoslovakia | 99.6 /100 | #48 | Exceptional 14.8% |
| Immigrants | Bulgaria | 99.6 /100 | #49 | Exceptional 14.8% |
Demographics Similar to Poles by Child Poverty Under the Age of 5
In terms of child poverty under the age of 5, the demographic groups most similar to Poles are Scandinavian (15.7%, a difference of 0.060%), Ukrainian (15.7%, a difference of 0.090%), Immigrants from South Eastern Asia (15.7%, a difference of 0.10%), Immigrants from Croatia (15.6%, a difference of 0.11%), and Immigrants from France (15.6%, a difference of 0.11%).
| Demographics | Rating | Rank | Child Poverty Under the Age of 5 |
| Immigrants | Netherlands | 97.6 /100 | #84 | Exceptional 15.6% |
| Immigrants | Latvia | 97.4 /100 | #85 | Exceptional 15.6% |
| Immigrants | Malaysia | 97.4 /100 | #86 | Exceptional 15.6% |
| Immigrants | Vietnam | 97.4 /100 | #87 | Exceptional 15.6% |
| Jordanians | 97.3 /100 | #88 | Exceptional 15.6% |
| Immigrants | Croatia | 97.3 /100 | #89 | Exceptional 15.6% |
| Immigrants | France | 97.3 /100 | #90 | Exceptional 15.6% |
| Poles | 97.2 /100 | #91 | Exceptional 15.7% |
| Scandinavians | 97.1 /100 | #92 | Exceptional 15.7% |
| Ukrainians | 97.1 /100 | #93 | Exceptional 15.7% |
| Immigrants | South Eastern Asia | 97.1 /100 | #94 | Exceptional 15.7% |
| Immigrants | Switzerland | 96.4 /100 | #95 | Exceptional 15.8% |
| Immigrants | Kazakhstan | 96.2 /100 | #96 | Exceptional 15.8% |
| Macedonians | 96.2 /100 | #97 | Exceptional 15.8% |
| Immigrants | South Africa | 96.1 /100 | #98 | Exceptional 15.8% |