Soviet Union vs Immigrants from Lebanon Child Poverty Under the Age of 5
COMPARE
Soviet Union
Immigrants from Lebanon
Child Poverty Under the Age of 5
Child Poverty Under the Age of 5 Comparison
Soviet Union
Immigrants from Lebanon
14.7%
CHILD POVERTY UNDER THE AGE OF 5
99.7/ 100
METRIC RATING
42nd/ 347
METRIC RANK
17.3%
CHILD POVERTY UNDER THE AGE OF 5
47.6/ 100
METRIC RATING
175th/ 347
METRIC RANK
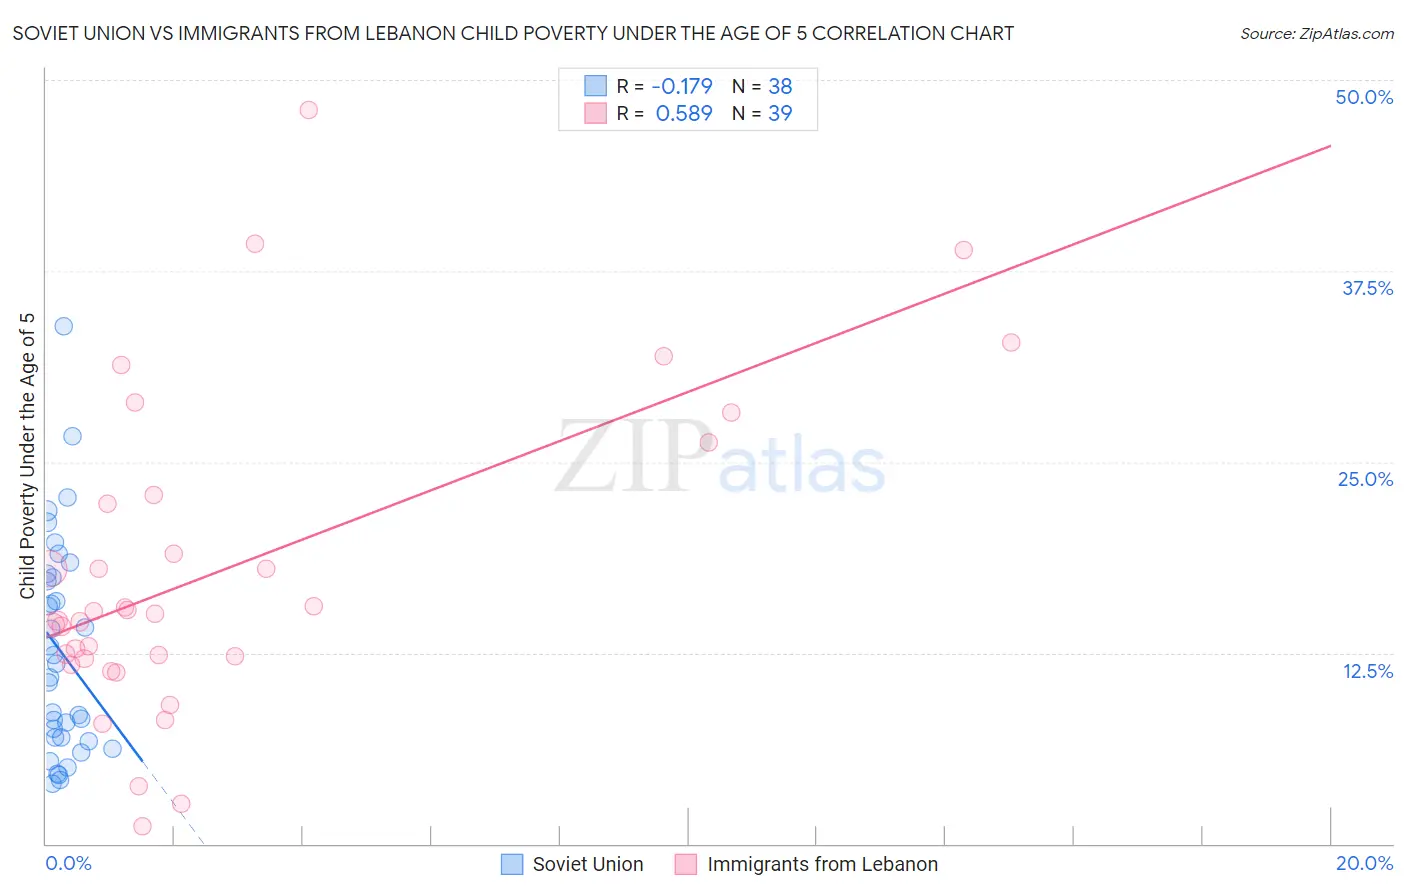
Soviet Union vs Immigrants from Lebanon Child Poverty Under the Age of 5 Correlation Chart
The statistical analysis conducted on geographies consisting of 43,034,712 people shows a poor negative correlation between the proportion of Soviet Union and poverty level among children under the age of 5 in the United States with a correlation coefficient (R) of -0.179 and weighted average of 14.7%. Similarly, the statistical analysis conducted on geographies consisting of 210,438,499 people shows a substantial positive correlation between the proportion of Immigrants from Lebanon and poverty level among children under the age of 5 in the United States with a correlation coefficient (R) of 0.589 and weighted average of 17.3%, a difference of 17.6%.
Child Poverty Under the Age of 5 Correlation Summary
| Measurement | Soviet Union | Immigrants from Lebanon |
| Minimum | 3.9% | 1.2% |
| Maximum | 33.8% | 48.0% |
| Range | 29.9% | 46.9% |
| Mean | 12.6% | 17.9% |
| Median | 11.3% | 15.0% |
| Interquartile 25% (IQ1) | 6.9% | 12.1% |
| Interquartile 75% (IQ3) | 17.4% | 22.8% |
| Interquartile Range (IQR) | 10.5% | 10.7% |
| Standard Deviation (Sample) | 7.0% | 10.4% |
| Standard Deviation (Population) | 7.0% | 10.3% |
Similar Demographics by Child Poverty Under the Age of 5
Demographics Similar to Soviet Union by Child Poverty Under the Age of 5
In terms of child poverty under the age of 5, the demographic groups most similar to Soviet Union are Immigrants from Greece (14.7%, a difference of 0.0%), Immigrants from Philippines (14.7%, a difference of 0.13%), Immigrants from Belarus (14.7%, a difference of 0.16%), Laotian (14.7%, a difference of 0.26%), and Immigrants from Australia (14.6%, a difference of 0.28%).
| Demographics | Rating | Rank | Child Poverty Under the Age of 5 |
| Latvians | 99.8 /100 | #35 | Exceptional 14.5% |
| Maltese | 99.8 /100 | #36 | Exceptional 14.5% |
| Turks | 99.7 /100 | #37 | Exceptional 14.6% |
| Eastern Europeans | 99.7 /100 | #38 | Exceptional 14.6% |
| Norwegians | 99.7 /100 | #39 | Exceptional 14.6% |
| Immigrants | Australia | 99.7 /100 | #40 | Exceptional 14.6% |
| Immigrants | Belarus | 99.7 /100 | #41 | Exceptional 14.7% |
| Soviet Union | 99.7 /100 | #42 | Exceptional 14.7% |
| Immigrants | Greece | 99.7 /100 | #43 | Exceptional 14.7% |
| Immigrants | Philippines | 99.7 /100 | #44 | Exceptional 14.7% |
| Laotians | 99.6 /100 | #45 | Exceptional 14.7% |
| Tsimshian | 99.6 /100 | #46 | Exceptional 14.7% |
| Russians | 99.6 /100 | #47 | Exceptional 14.8% |
| Immigrants | Czechoslovakia | 99.6 /100 | #48 | Exceptional 14.8% |
| Immigrants | Bulgaria | 99.6 /100 | #49 | Exceptional 14.8% |
Demographics Similar to Immigrants from Lebanon by Child Poverty Under the Age of 5
In terms of child poverty under the age of 5, the demographic groups most similar to Immigrants from Lebanon are Immigrants from Saudi Arabia (17.2%, a difference of 0.25%), Immigrants from Iraq (17.3%, a difference of 0.25%), Immigrants from Sierra Leone (17.3%, a difference of 0.41%), Immigrants from Cameroon (17.4%, a difference of 0.51%), and Hawaiian (17.4%, a difference of 0.64%).
| Demographics | Rating | Rank | Child Poverty Under the Age of 5 |
| Uruguayans | 60.5 /100 | #168 | Good 17.0% |
| Immigrants | South America | 60.0 /100 | #169 | Good 17.1% |
| Immigrants | Western Asia | 59.2 /100 | #170 | Average 17.1% |
| Immigrants | Morocco | 58.9 /100 | #171 | Average 17.1% |
| Yugoslavians | 54.1 /100 | #172 | Average 17.2% |
| Welsh | 54.0 /100 | #173 | Average 17.2% |
| Immigrants | Saudi Arabia | 50.0 /100 | #174 | Average 17.2% |
| Immigrants | Lebanon | 47.6 /100 | #175 | Average 17.3% |
| Immigrants | Iraq | 45.2 /100 | #176 | Average 17.3% |
| Immigrants | Sierra Leone | 43.6 /100 | #177 | Average 17.3% |
| Immigrants | Cameroon | 42.7 /100 | #178 | Average 17.4% |
| Hawaiians | 41.5 /100 | #179 | Average 17.4% |
| South American Indians | 41.4 /100 | #180 | Average 17.4% |
| Immigrants | Germany | 41.0 /100 | #181 | Average 17.4% |
| Arabs | 40.7 /100 | #182 | Average 17.4% |