Immigrants from Chile vs Inupiat Family Poverty
COMPARE
Immigrants from Chile
Inupiat
Family Poverty
Family Poverty Comparison
Immigrants from Chile
Inupiat
8.9%
FAMILY POVERTY
59.6/ 100
METRIC RATING
169th/ 347
METRIC RANK
12.5%
FAMILY POVERTY
0.0/ 100
METRIC RATING
320th/ 347
METRIC RANK
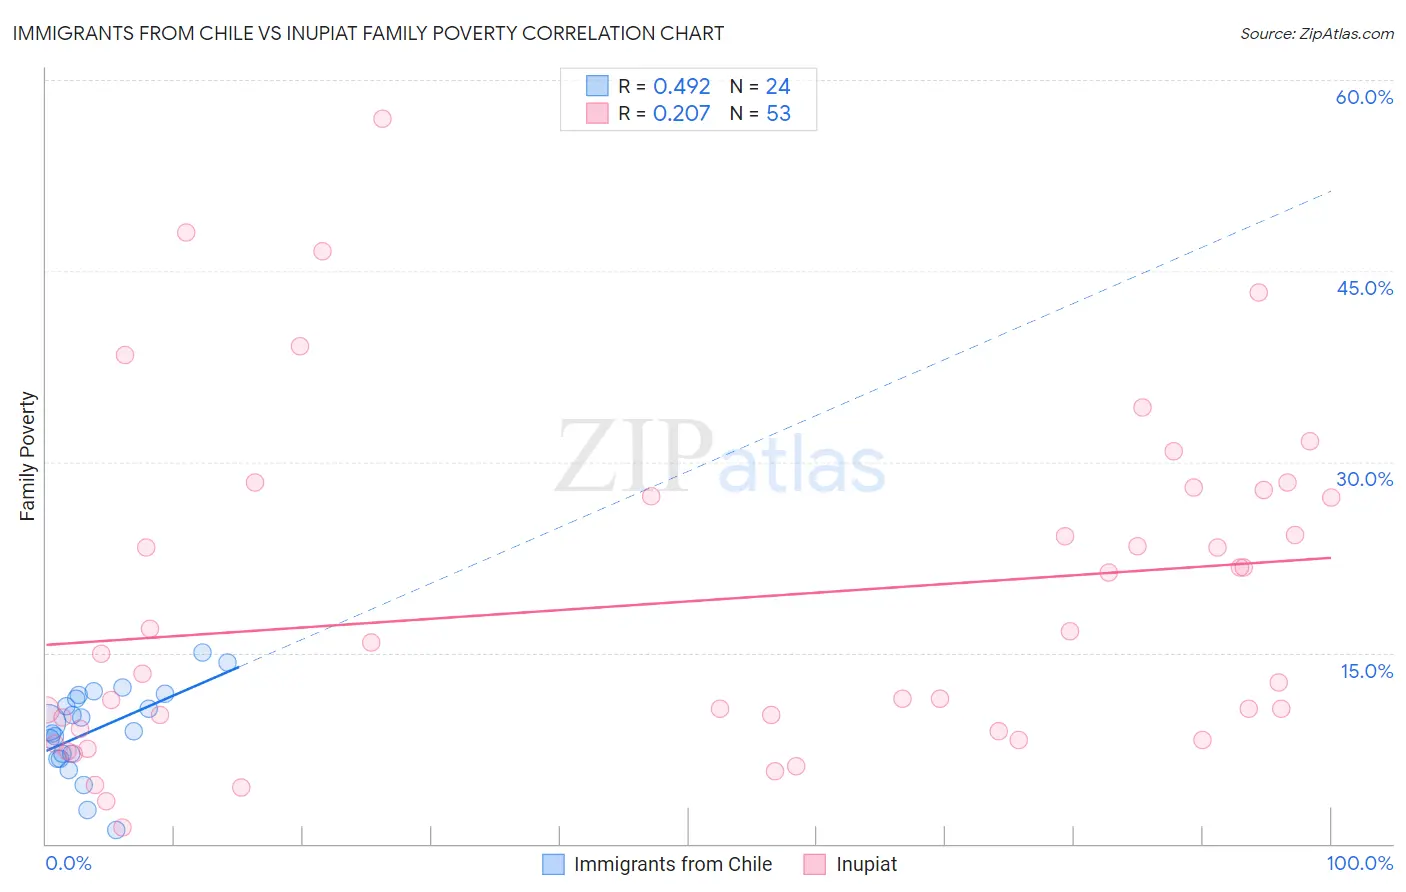
Immigrants from Chile vs Inupiat Family Poverty Correlation Chart
The statistical analysis conducted on geographies consisting of 218,435,761 people shows a moderate positive correlation between the proportion of Immigrants from Chile and poverty level among families in the United States with a correlation coefficient (R) of 0.492 and weighted average of 8.9%. Similarly, the statistical analysis conducted on geographies consisting of 96,272,852 people shows a weak positive correlation between the proportion of Inupiat and poverty level among families in the United States with a correlation coefficient (R) of 0.207 and weighted average of 12.5%, a difference of 40.2%.
Family Poverty Correlation Summary
| Measurement | Immigrants from Chile | Inupiat |
| Minimum | 1.0% | 1.3% |
| Maximum | 15.0% | 56.9% |
| Range | 14.0% | 55.6% |
| Mean | 9.0% | 19.0% |
| Median | 9.2% | 14.9% |
| Interquartile 25% (IQ1) | 6.9% | 8.9% |
| Interquartile 75% (IQ3) | 11.5% | 27.5% |
| Interquartile Range (IQR) | 4.6% | 18.6% |
| Standard Deviation (Sample) | 3.4% | 12.9% |
| Standard Deviation (Population) | 3.3% | 12.8% |
Similar Demographics by Family Poverty
Demographics Similar to Immigrants from Chile by Family Poverty
In terms of family poverty, the demographic groups most similar to Immigrants from Chile are Kenyan (8.9%, a difference of 0.19%), Lebanese (8.9%, a difference of 0.27%), Immigrants from Peru (8.9%, a difference of 0.29%), Israeli (8.9%, a difference of 0.35%), and Immigrants from Ethiopia (8.9%, a difference of 0.41%).
| Demographics | Rating | Rank | Family Poverty |
| Ethiopians | 66.3 /100 | #162 | Good 8.8% |
| Pennsylvania Germans | 66.0 /100 | #163 | Good 8.8% |
| Celtics | 64.9 /100 | #164 | Good 8.8% |
| Guamanians/Chamorros | 64.7 /100 | #165 | Good 8.8% |
| Afghans | 63.5 /100 | #166 | Good 8.8% |
| Immigrants | Ethiopia | 62.5 /100 | #167 | Good 8.9% |
| Israelis | 62.1 /100 | #168 | Good 8.9% |
| Immigrants | Chile | 59.6 /100 | #169 | Average 8.9% |
| Kenyans | 58.2 /100 | #170 | Average 8.9% |
| Lebanese | 57.6 /100 | #171 | Average 8.9% |
| Immigrants | Peru | 57.5 /100 | #172 | Average 8.9% |
| Immigrants | Fiji | 56.4 /100 | #173 | Average 8.9% |
| Immigrants | Albania | 50.0 /100 | #174 | Average 9.0% |
| Costa Ricans | 49.3 /100 | #175 | Average 9.0% |
| Immigrants | Syria | 47.5 /100 | #176 | Average 9.0% |
Demographics Similar to Inupiat by Family Poverty
In terms of family poverty, the demographic groups most similar to Inupiat are British West Indian (12.4%, a difference of 0.48%), U.S. Virgin Islander (12.4%, a difference of 0.53%), Immigrants from Grenada (12.4%, a difference of 0.54%), Honduran (12.4%, a difference of 0.76%), and Immigrants from Mexico (12.3%, a difference of 1.5%).
| Demographics | Rating | Rank | Family Poverty |
| Immigrants | Caribbean | 0.0 /100 | #313 | Tragic 12.2% |
| Kiowa | 0.0 /100 | #314 | Tragic 12.2% |
| Immigrants | Mexico | 0.0 /100 | #315 | Tragic 12.3% |
| Hondurans | 0.0 /100 | #316 | Tragic 12.4% |
| Immigrants | Grenada | 0.0 /100 | #317 | Tragic 12.4% |
| U.S. Virgin Islanders | 0.0 /100 | #318 | Tragic 12.4% |
| British West Indians | 0.0 /100 | #319 | Tragic 12.4% |
| Inupiat | 0.0 /100 | #320 | Tragic 12.5% |
| Arapaho | 0.0 /100 | #321 | Tragic 12.7% |
| Immigrants | Honduras | 0.0 /100 | #322 | Tragic 12.7% |
| Menominee | 0.0 /100 | #323 | Tragic 12.7% |
| Immigrants | Dominica | 0.0 /100 | #324 | Tragic 12.7% |
| Paiute | 0.0 /100 | #325 | Tragic 13.0% |
| Colville | 0.0 /100 | #326 | Tragic 13.0% |
| Yakama | 0.0 /100 | #327 | Tragic 13.1% |